. 2013 Dec;16(10):791-805.
doi: 10.2174/1386207311301010004.

Modulators of the microRNA biogenesis pathway via arrayed lentiviral enabled RNAi screening for drug and biomarker discovery

Affiliations

Modulators of the microRNA biogenesis pathway via arrayed lentiviral enabled RNAi screening for drug and biomarker discovery

David Shum et al. Comb Chem High Throughput Screen. 2013 Dec.

Abstract

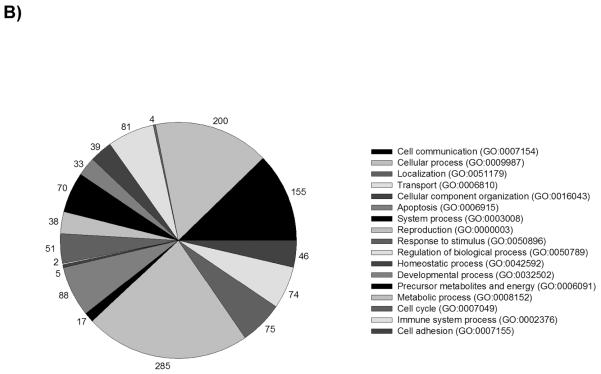
MicroRNAs (miRNAs) are small endogenous and conserved non-coding RNA molecules that regulate gene expression. Although the first miRNA was discovered well over sixteen years ago, little is known about their biogenesis and it is only recently that we have begun to understand their scope and diversity. For this purpose, we performed an RNAi screen aimed at identifying genes involved in their biogenesis pathway with a potential use as biomarkers. Using a previously developed miRNA 21 (miR-21) EGFP-based biosensor cell based assay monitoring green fluorescence enhancements, we performed an arrayed short hairpin RNA (shRNA) screen against a lentiviral particle ready TRC1 library covering 16,039 genes in 384-well plate format, and interrogating the genome one gene at a time building a panoramic view of endogenous miRNA activity. Using the BDA method for RNAi data analysis, we nominate 497 gene candidates the knockdown of which increased the EGFP fluorescence and yielding an initial hit rate of 3.09%; of which only 22, with reported validated clones, are deemed high-confidence gene candidates. An unexpected and surprising result was that only DROSHA was identified as a hit out of the seven core essential miRNA biogenesis genes; suggesting that perhaps intracellular shRNA processing into the correct duplex may be cell dependent and with differential outcome. Biological classification revealed several major control junctions among them genes involved in transport and vesicular trafficking. In summary, we report on 22 high confidence gene candidate regulators of miRNA biogenesis with potential use in drug and biomarker discovery.


Figures

Figure 1
Figure 1
Assay optimization for shRNA screening Assay was optimized for shRNA screening using a matrix format-based design. A) Assessment of cell tolerance to polybrene of reporter cells at two seeding densities of 500 and 1,000 cells per well in dose response studies for 96 h with NUCL count readout. B) Puromycin kill curve following treatment of reporter cells at two seeding densities of 500 and 1,000 cells per well in 8 μg/mL of polybrene for 96 h followed by dose response studies in puromycin for 120 h with NUCL count readout. C) Transduction of control lentiviral particles of cells at a seeding density of 1,000 cells per well in 8 μg/mL of polybrene for 72 h followed by puromycin selection of 1 μg/mL for 120 h with NUCL count readout, D) TurboGFP signal, and E) images acquired using the IN Cell Analyzer 3000 (INCA3000) with green channel for TurboGFP signal and blue channel for Hoechst-stained nuclei.
Figure 1
Figure 1
Assay optimization for shRNA screening Assay was optimized for shRNA screening using a matrix format-based design. A) Assessment of cell tolerance to polybrene of reporter cells at two seeding densities of 500 and 1,000 cells per well in dose response studies for 96 h with NUCL count readout. B) Puromycin kill curve following treatment of reporter cells at two seeding densities of 500 and 1,000 cells per well in 8 μg/mL of polybrene for 96 h followed by dose response studies in puromycin for 120 h with NUCL count readout. C) Transduction of control lentiviral particles of cells at a seeding density of 1,000 cells per well in 8 μg/mL of polybrene for 72 h followed by puromycin selection of 1 μg/mL for 120 h with NUCL count readout, D) TurboGFP signal, and E) images acquired using the IN Cell Analyzer 3000 (INCA3000) with green channel for TurboGFP signal and blue channel for Hoechst-stained nuclei.
Figure 2
Figure 2
Assessment of assay performance during shRNA screening Cells (1,000 cells per well) were screened against TRC1 at a MOI of 4 covering 16,039 genes. A) Box plot and analysis of controls during screening. B) Distribution plot of individual shRNA hairpin activity during screening for EGFP signal. C) Distribution plot of individual shRNA hairpin activity during screening for NUCL count. D) Plot of active shRNA hairpins per gene for EGFP signal. E) Plot of active shRNA hairpins per gene for NUCL count.
Figure 2
Figure 2
Assessment of assay performance during shRNA screening Cells (1,000 cells per well) were screened against TRC1 at a MOI of 4 covering 16,039 genes. A) Box plot and analysis of controls during screening. B) Distribution plot of individual shRNA hairpin activity during screening for EGFP signal. C) Distribution plot of individual shRNA hairpin activity during screening for NUCL count. D) Plot of active shRNA hairpins per gene for EGFP signal. E) Plot of active shRNA hairpins per gene for NUCL count.
Figure 3
Figure 3
BDA analysis method workflow High-stringency analysis nominates 481 non-essential and 16 essential candidate modulators of miRNA biogenesis. HC_OTE; High confidence off-target effects, LC_OTE; Low confidence off-target effects, No_OTE; No off-target effects.
Figure 4
Figure 4
Validation data for the shRNA hairpins scored as active in the first step of active duplex identification by the BDA method. Validation data was provided by Sigma-Aldrich.
Figure 5
Figure 5
Biological classification of 497 nominated gene candidates A) Network mapping using Ingenuity Pathway Analysis shows protein-protein interactions among the nominated gene candidates (blue) and known core components (bold red) or regulators of miRNA biogenesis (grey). B) Categorization of nominated gene candidates into functional classes based on the enrichment of Gene Ontology (GO) terms. The number of genes participating in each category were obtained from PANTHER classification system. C) Five gene clusters found within nominated candidates generated using the MiMI and MCODE analysis. D) Classification of nominated gene candidate into protein classes (PC) and enrichment determined using PANTHER classification system. E) Prominent pathways among nominated gene candidates determined at a p-value of < 0.05 and false discovery rate of 10% using the Metacore pathway analysis software.
Figure 5
Figure 5
Biological classification of 497 nominated gene candidates A) Network mapping using Ingenuity Pathway Analysis shows protein-protein interactions among the nominated gene candidates (blue) and known core components (bold red) or regulators of miRNA biogenesis (grey). B) Categorization of nominated gene candidates into functional classes based on the enrichment of Gene Ontology (GO) terms. The number of genes participating in each category were obtained from PANTHER classification system. C) Five gene clusters found within nominated candidates generated using the MiMI and MCODE analysis. D) Classification of nominated gene candidate into protein classes (PC) and enrichment determined using PANTHER classification system. E) Prominent pathways among nominated gene candidates determined at a p-value of < 0.05 and false discovery rate of 10% using the Metacore pathway analysis software.

References

    1. Bartel DP. MicroRNAs: genomics, biogenesis, mechanism, and function. Cell. 2004;116(2):281–297. - PubMed
    1. Gregory RI, Yan KP, Amuthan G, Chendrimada T, Doratotaj B, Cooch N, Shiekhattar R. The Microprocessor complex mediates the genesis of microRNAs. Nature. 2004;432(7014):235–240. - PubMed
    1. Lee Y, Ahn C, Han J, Choi H, Kim J, Lee J, Provost P, Radmark O, Kim S, Kim VN. The nuclear RNase III Drosha initiates microRNA processing. Nature. 2003;425(6956):415–419. - PubMed
    1. Lee Y, Han J, Yeom KH, Jin H, Kim VN. Drosha in primary microRNA processing. Cold Spring Harb Symp Quant Biol. 2006;71:51–57. - PubMed
    1. Han J, Lee Y, Yeom KH, Kim YK, Jin H, Kim VN. The Drosha-DGCR8 complex in primary microRNA processing. Genes Dev. 2004;18(24):3016–3027. - PMC - PubMed

Publication types