. 2013 Nov;195(3):1077-86.
doi: 10.1534/genetics.113.153346. Epub 2013 Aug 26.

High-throughput computer vision introduces the time axis to a quantitative trait map of a plant growth response

Affiliations

High-throughput computer vision introduces the time axis to a quantitative trait map of a plant growth response

Candace R Moore et al. Genetics. 2013 Nov.

Abstract

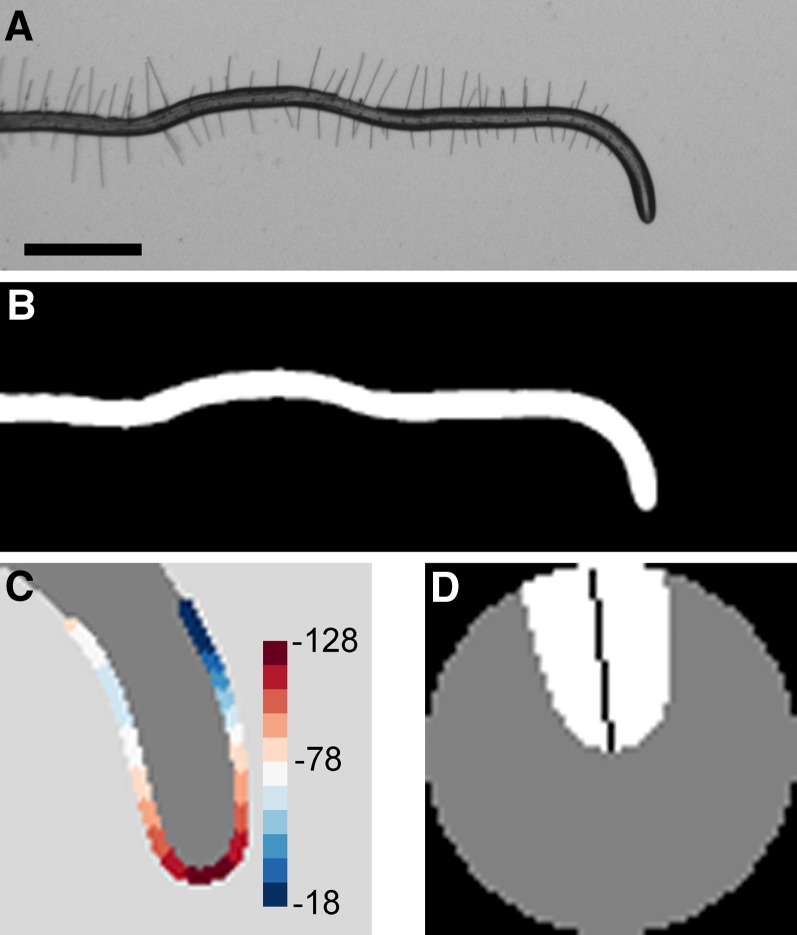
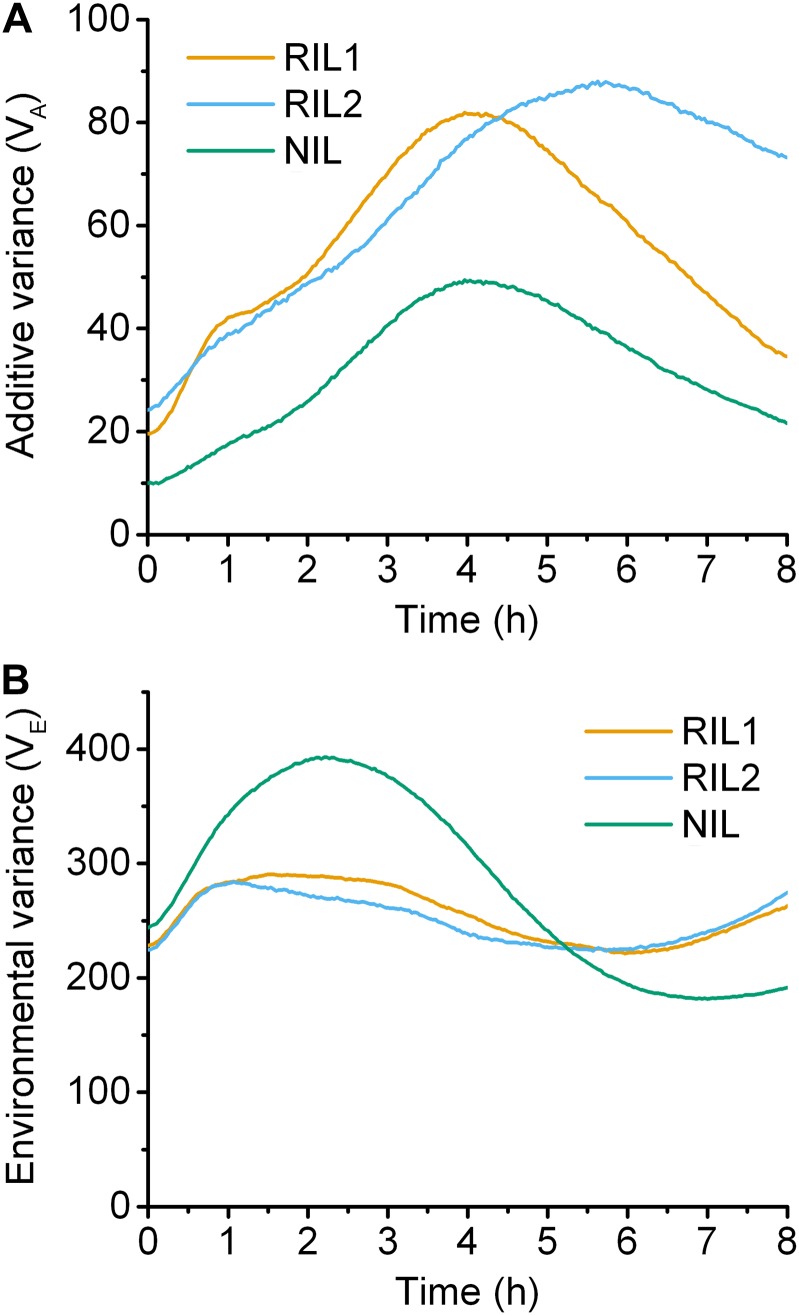
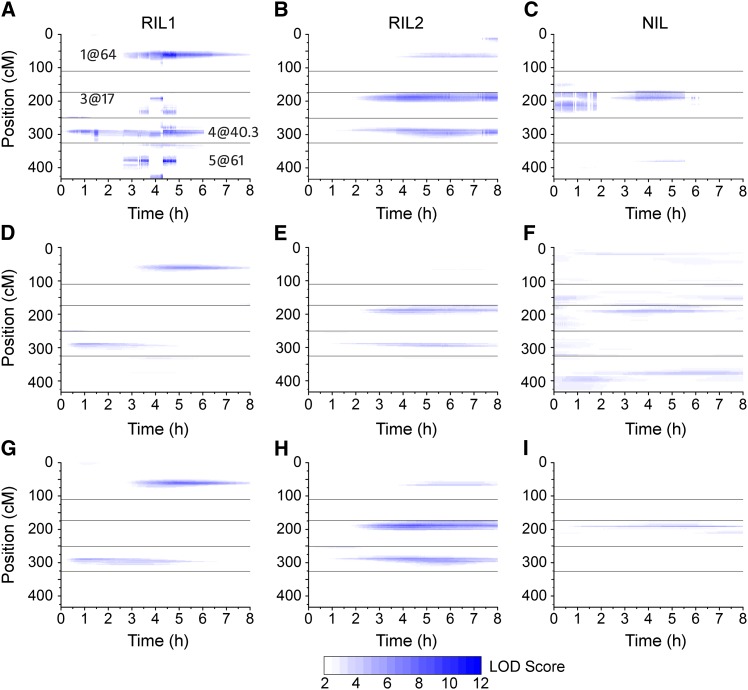
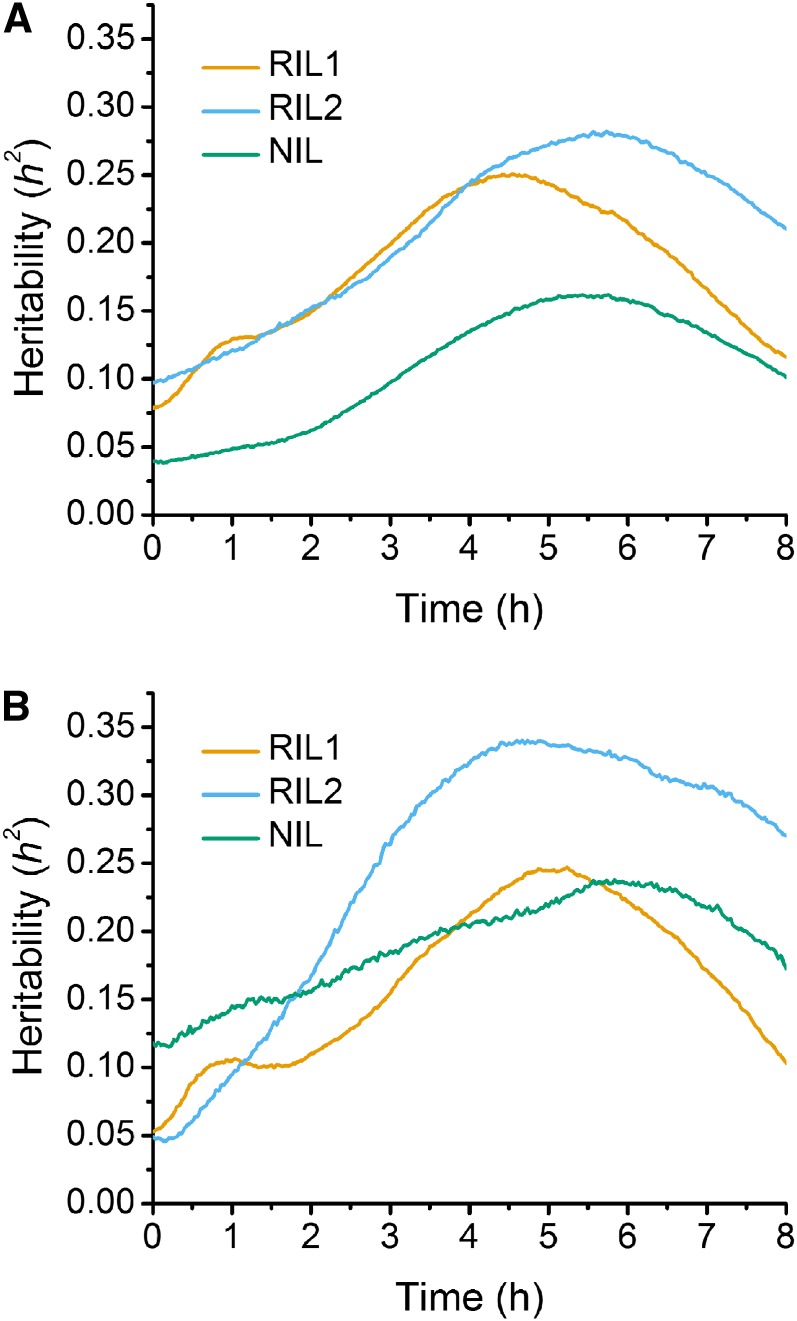
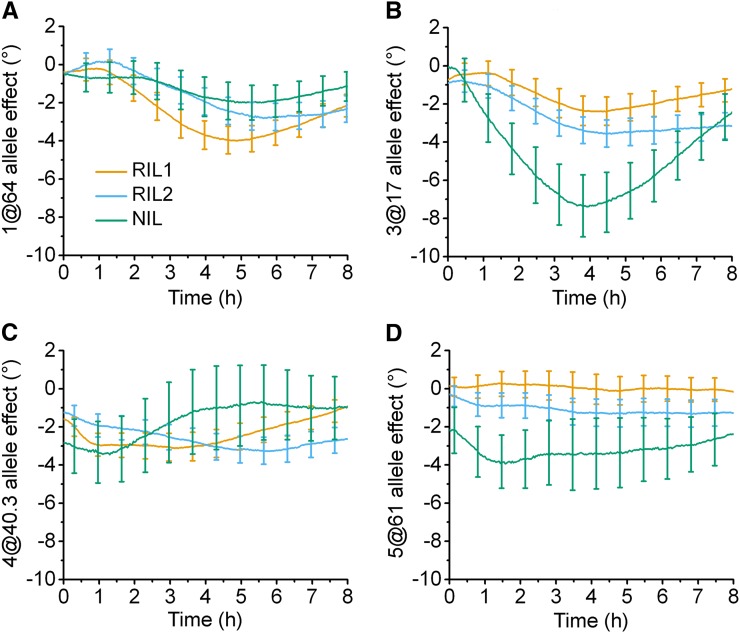
Automated image acquisition, a custom analysis algorithm, and a distributed computing resource were used to add time as a third dimension to a quantitative trait locus (QTL) map for plant root gravitropism, a model growth response to an environmental cue. Digital images of Arabidopsis thaliana seedling roots from two independently reared sets of 162 recombinant inbred lines (RILs) and one set of 92 near isogenic lines (NILs) derived from a Cape Verde Islands (Cvi) × Landsberg erecta (Ler) cross were collected automatically every 2 min for 8 hr following induction of gravitropism by 90° reorientation of the sample. High-throughput computing (HTC) was used to measure root tip angle in each of the 1.1 million images acquired and perform statistical regression of tip angle against the genotype at each of the 234 RIL or 102 NIL DNA markers independently at each time point using a standard stepwise procedure. Time-dependent QTL were detected on chromosomes 1, 3, and 4 by this mapping method and by an approach developed to treat the phenotype time course as a function-valued trait. The QTL on chromosome 4 was earliest, appearing at 0.5 hr and remaining significant for 5 hr, while the QTL on chromosome 1 appeared at 3 hr and thereafter remained significant. The Cvi allele generally had a negative effect of 2.6-4.0%. Heritability due to the QTL approached 25%. This study shows how computer vision and statistical genetic analysis by HTC can characterize the developmental timing of genetic architectures.

Keywords: Arabidopsis; QTL; natural variation; root gravitropism.


Figures

Figure 1
Figure 1
Root tip angle determined by image analysis. (A) Grayscale image of a representative root undergoing a growth response to a change in the gravity vector, or gravitropism. Bar, 1 mm. (B) Binarized image of the responding root. (C) Curvature values are calculated at each boundary point along the root apex. The point of highest curvature is taken to be the root tip. Color legend indicates curvature values in mm−1. (D) A patch centered at the root tip is subjected to principal components analysis. The first eigenvector (black line) determines the tip angle relative to the horizon.
Figure 2
Figure 2
Quantifying root tip angle during gravitropism generates a time-course phenotype. (A) Representative series of images of a root responding to gravity at 2-hr intervals. At the beginning of the experiment, seedlings were rotated 90° such that the root tip was approximately horizontal to the gravity vector. By 8 hr after rotation, the root had grown to reorient its tip parallel to the direction of gravity. Bar, 0.5 mm. (B–D) Tip angle development during gravitropism in the RIL1, RIL2, and NIL datasets. The response of the Cvi parental line is shown by a black line, Ler by an orange line, and the other lines indicate the responses of representatives of the population of inbred lines (labeled A, B, and C). Vertical bars indicate the standard error of the mean. For RIL1, n = 27, 28, 10, 10, and 18 for Cvi, Ler, RIL1-A, RIL1-B, and RIL1-C. For RIL2, n = 14, 18, 18, 11, and 12 for Cvi, Ler, RIL2-A, RIL2-B, and RIL2-C. For NIL, n = 32, 33, and 20 for NIL-A, NIL-B, and NIL-C.
Figure 3
Figure 3
Genetic and environmental contributions to variance. (A) The proportion of the phenotypic variance attributed to the additive genetic variation. (B) The environmental contribution to the phenotypic variance. Orange, blue, and green lines indicate the RIL1, RIL2, and NIL populations, respectively.
Figure 4
Figure 4
Time course of QTL development. Magnitude of LOD score is displayed as color intensity as a function of time. (A–C) Profile LOD scores for models selected by stepwise QTL analyses, considering each time point individually. For RIL1, (Tm, TiH, TiL) = (2.58, 3.41, 1.53); for RIL2, (Tm, TiH, TiL) = (2.56, 3.44, 1.63); and for NIL, (Tm, TiH, TiL) = (2.75, 2.40, 0.67). (D–F) Single-QTL analysis results from RIL1, RIL2, and NIL populations. Threshold for significance of single QTL is 1.91 for RIL1, 1.99 for RIL2, and 1.91 for NIL. (G–I) Profile LOD scores for the model selected by stepwise QTL analyses using the SLOD criterion. For RIL1, (Tm, TiH, TiL) = (1.91, 2.41, 1.10); for RIL2, (Tm, TiH, TiL) = (1.99, 2.62, 1.51); and for NIL, (Tm, TiH, TiL) = (1.91, 2.40, 1.66). The position of the loci on the y-axis is shown as the cumulative position of the five Arabidopsis chromosomes. Horizontal lines indicate chromosome breaks. The x-axis shows time in hours since onset of gravistimulation. All coordinates whose LOD scores were not significant are shown in white. Darker blue colors indicate higher support for the loci.
Figure 5
Figure 5
(A) Heritability calculated via results from stepwise QTL analysis at individual time points. (B) Heritability based on the chosen SLOD model from each population. Orange, blue, and green lines indicate the RIL1, RIL2, and NIL populations, respectively.
Figure 6
Figure 6
Time-dependent allele effects on root tip angle during gravitropism. The four QTL found by stepwise QTL analyses at each time point that were common to at least two populations were added to a model and the contribution of each locus was estimated. Positive values indicate that substitution of a Cvi allele at the indicated locus increases the tip angle trait, while a negative value corresponds to the Ler allele increasing the trait value. The 95% confidence interval for the degree of the effect is displayed as error bars. (A) Chromosome 1 at 64 cM. (B) Chromosome 3 at 17 cM. (C) Chromosome 4 at 40.3 cM. (D) Chromosome 5 at 61 cM.

References

    1. Alonso-Blanco C., Peeters A. J. M., Koornneef M., Lister C., Dean C., et al. , 1998. Development of an AFLP based linkage map of Ler, Col and Cvi Arabidopsis thaliana ecotypes and construction of a Ler/Cvi recombinant inbred line population. Plant J. 14: 259–271 - PubMed
    1. Baldwin K. L., Strohm A. K., Masson P. H., 2013. Gravity sensing and signal transduction in vascular plant primary roots. Am. J. Bot. 100: 126–142 - PubMed
    1. Blancaflor E. B., Masson P. H., 2003. Plant gravitropism. Unraveling the ups and downs of a complex process. Plant Physiol. 133: 1677–1690 - PMC - PubMed
    1. Boonsirichai K., Guan C., Chen R., Masson P. H., 2002. Root gravitropism: an experimental tool to investigate basic cellular and molecular processes underlying mechanosensing and signal transmission in plants. Annu. Rev. Plant Biol. 53: 421–447 - PubMed
    1. Broman K. W., Wu H., Sen S., Churchill G. A., 2003. R/qtl: QTL mapping in experimental crosses. Bioinformatics 19: 889–890 - PubMed

Publication types

LinkOut - more resources