. 2013 Nov;195(3):831-44.
doi: 10.1534/genetics.113.153981. Epub 2013 Aug 26.

Nutritional control of epigenetic processes in yeast and human cells

Affiliations

Nutritional control of epigenetic processes in yeast and human cells

Meru J Sadhu et al. Genetics. 2013 Nov.

Abstract

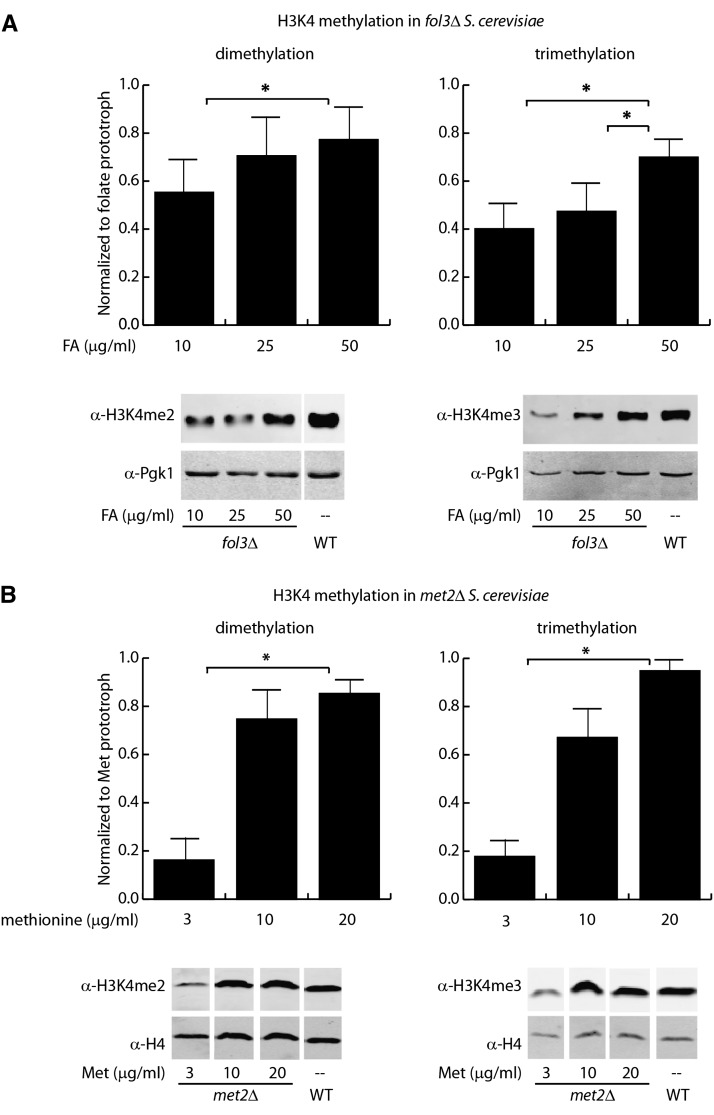
The vitamin folate is required for methionine homeostasis in all organisms. In addition to its role in protein synthesis, methionine is the precursor to S-adenosyl-methionine (SAM), which is used in myriad cellular methylation reactions, including all histone methylation reactions. Here, we demonstrate that folate and methionine deficiency led to reduced methylation of lysine 4 of histone H3 (H3K4) in Saccharomyces cerevisiae. The effect of nutritional deficiency on H3K79 methylation was less pronounced, but was exacerbated in S. cerevisiae carrying a hypomorphic allele of Dot1, the enzyme responsible for H3K79 methylation. This result suggested a hierarchy of epigenetic modifications in terms of their susceptibility to nutritional limitations. Folate deficiency caused changes in gene transcription that mirrored the effect of complete loss of H3K4 methylation. Histone methylation was also found to respond to nutritional deficiency in the fission yeast Schizosaccharomyces pombe and in human cells in culture.

Keywords: S-adenosyl-methionine; Set1; folate; histone methylation; methionine.


Figures

Figure 1
Figure 1
Interaction between folate, methionine, and cellular methylation. Met2, not shown, is required for the synthesis of homocysteine. Note that although methionine synthesis requires cobalamin (vitamin B12) in many organisms, methionine synthesis in S. cerevisiae is cobalamin independent. SAM, S-adenosyl-methionine; SAH, S-adenosyl-homocysteine; MTHFR, methylenetetrahydrofolate reductase.
Figure 2
Figure 2
Effect of exogenous folinic acid and methionine on H3K4 methylation in S. cerevisiae. (A) H3K4 di- and trimethylation in fol3Δ cells grown at different concentrations of folinic acid. Here and elsewhere, folinic acid is abbreviated FA. Here and for Figures 5 and 7, for each replicate, histone methylation values were normalized to the value of a loading control from the same sample, either histone H4 or Pgk1, and then normalized to the value for a folate prototroph on the same blot. n = 7 for dimethylation; n = 8 for trimethylation. Error bars, standard error. (*) P < 0.05, Student’s t-test. Representative blots are shown below. (B) H3K4 di- and trimethylation in met2Δ cells grown at different concentrations of methionine. Normalization was as in A; n = 3.
Figure 3
Figure 3
Directness of effect of nutrition on H3K4 methylation. (A) H3K4 di- and trimethylation in folate-deficient fol3Δ cells after adding 15 µg/ml methionine. Quantification of band density normalized to quantification of Pgk1 band density is shown below each blot, after normalization to wild-type values. n = 2, with a representative blot shown. (B) H3K4 di- and trimethylation in wild-type and fol3Δ cells grown at different temperatures. Growth rate is shown as doubling time, calculated over the whole growth of the culture. Pgk1 band density served as a loading control. Quantification of band density normalized to quantification of Pgk1 band density is shown below each blot, after normalization to the wild-type value at 30°. (C) SET1 mRNA levels (left) and Set1-TAP protein levels (right) in folate-deficient, folate-replete, and wild-type cultures. RNA was measured by quantitative PCR and protein was measured by quantitative Western blotting. SET1 mRNA values were normalized to ACT1 mRNA from the same sample and then to wild type. Set1–TAP values were normalized to Pgk1 from the same sample as a loading control and then to wild type. n = 3.
Figure 4
Figure 4
Effect of folate deficiency on the expression of SET1-responsive genes. (A) PER33 expression, as determined by RT–PCR. All cDNA values were internally normalized to ACT1 cDNA values from the same cDNA preparation. Within an experiment, the expression values are normalized to wild type. n = 4. Here and elsewhere, (*) P < 0.05, Student’s t-test. Error bars, standard error. (B) BNA2 expression. Normalization was as in A; n = 3. (C) ChIP analysis of H3K4 trimethylation at PER33, as determined by qPCR. Values are expressed as the H3K4 trimethylation enrichment at PER33 relative to HMRA1 (a negative control locus), normalized to H3 enrichment at PER33 relative to HMRA1. n = 2. (D) ChIP analysis of H3K4 trimethylation at BNA2, as determined by qPCR. Normalization was as in C; n = 2.
Figure 5
Figure 5
Effect of exogenous folinic acid on H3K79 methylation in S. cerevisiae. All normalizations are as in Figure 2. (A) H3K79 di- and trimethylation in fol3Δ cells grown at different concentrations of folinic acid. n = 3 for dimethylation; n = 4 for trimethylation. Error bars, standard error. The difference between H3K79 trimethylation between 50 μg/ml folinic acid and 10 μg/ml folinic acid was marginally significant at P < 0.05, Student’s t-test. (B) H3K79 di- and tri-methylation in fol3Δ dot1–G401A cells grown at different concentrations of folinic acid. Normalization was to the level of methylation in a folate prototroph with wild-type DOT1. n = 3. (*) P < 0.05, Student’s t-test.
Figure 6
Figure 6
Measurements of SAM concentration in cell extracts from fol3Δ cells grown at varying folate concentrations. (A) SAM detection by LC-MS. n = 3. (*) P < 0.05, Student’s t-test. Error bars, standard error. (B) Detection of arginine, lysine, tryptophan, and S-adenosyl-homocysteine (SAH) in the same cellular extracts as in A, by LC-MS. (C) Binding of the Pi SAM-I riboswitch aptamer to either purified SAM or SAM from cellular extracts. n = 3 for extracts; a representative gel is shown. (D) Quantification of the fraction of RNA bound to SAM from the experiment as shown in C (graph includes all three replicates); values are expressed as the percentage of aptamer RNA in the bound fraction (lower band) compared to the percentage of aptamer RNA in the bound fraction in the 1 mM SAM control lane, after the background signal from the 0 mM SAM control lane had been subtracted from both values.
Figure 7
Figure 7
Effect of exogenous folinic acid and methionine on H3K4 methylation in S. pombe. All normalizations are as in Figure 2; n = 3 for all graphs. (*) P < 0.05, Student’s t-test. Error bars, standard error. (A) H3K4 di- and tri-methylation in S. pombe fol1Δ cells grown at different concentrations of folinic acid. (B) H3K4 di- and tri-methylation in S. pombe met6Δ cells grown at different concentrations of methionine.
Figure 8
Figure 8
Effect of exogenous folinic acid and methionine on histone methylation in human K562 cells. (A) H3K4 trimethylation in cells grown in defined medium containing different levels of folinic acid and methionine. Values were normalized to values for H4 from the same sample and then normalized to the nutrient-rich culture from the same experiment. n = 6. (*) P < 0.05, Student’s t-test. Error bars, standard error. (B) H3K9 trimethylation in cells grown in defined medium containing different levels of folinic acid and methionine. Normalization was as in A. (C) Expression of HBG1 in cells grown in defined medium containing different levels of folinic acid and methionine. Values were normalized to ACTB from the same sample. n = 3. (D) Enrichment of H3K4 trimethylation at HBG1 relative to enrichment at HBE1 from the same sample (both values first normalized to input). n = 3.

Similar articles

Cited by

References

    1. Alkins S. A., Byrd J. C., Morgan S. K., Ward F. T., Weiss R. B., 1996. Anaphylactoid reactions to methotrexate. Cancer 77: 2123–2126 - PubMed
    1. Amberg D. C., Burke D., Strathern J. N., 2005. Methods in Yeast Genetics: A Cold Spring Harbor Laboratory Course Manual. Cold Spring Harbor Laboratory Press, Cold Spring Harbor, NY
    1. Ames B. N., 2006. Low micronutrient intake may accelerate the degenerative diseases of aging through allocation of scarce micronutrients by triage. Proc. Natl. Acad. Sci. USA 103: 17589–17594 - PMC - PubMed
    1. Aparicio O., Geisberg J. V., Sekinger E., Yang A., Moqtaderi Z., et al. , 2005. Chromatin immunoprecipitation for determining the association of proteins with specific genomic sequences in vivo, pp. 21.3.1–21.3.33 in Curr. Protoc. Mol. Biol. John Wiley & Sons, Inc., Hoboken, NJ. - PubMed
    1. Barski A., Cuddapah S., Cui K., Roh T. Y., Schones D. E., et al. , 2007. High-resolution profiling of histone methylations in the human genome. Cell 129: 823–837 - PubMed

Publication types

MeSH terms