. 2013 Sep 2;202(5):807-24.
doi: 10.1083/jcb.201302132. Epub 2013 Aug 26.

Distinct signaling mechanisms regulate migration in unconfined versus confined spaces

Affiliations

Distinct signaling mechanisms regulate migration in unconfined versus confined spaces

Wei-Chien Hung et al. J Cell Biol. .

Abstract

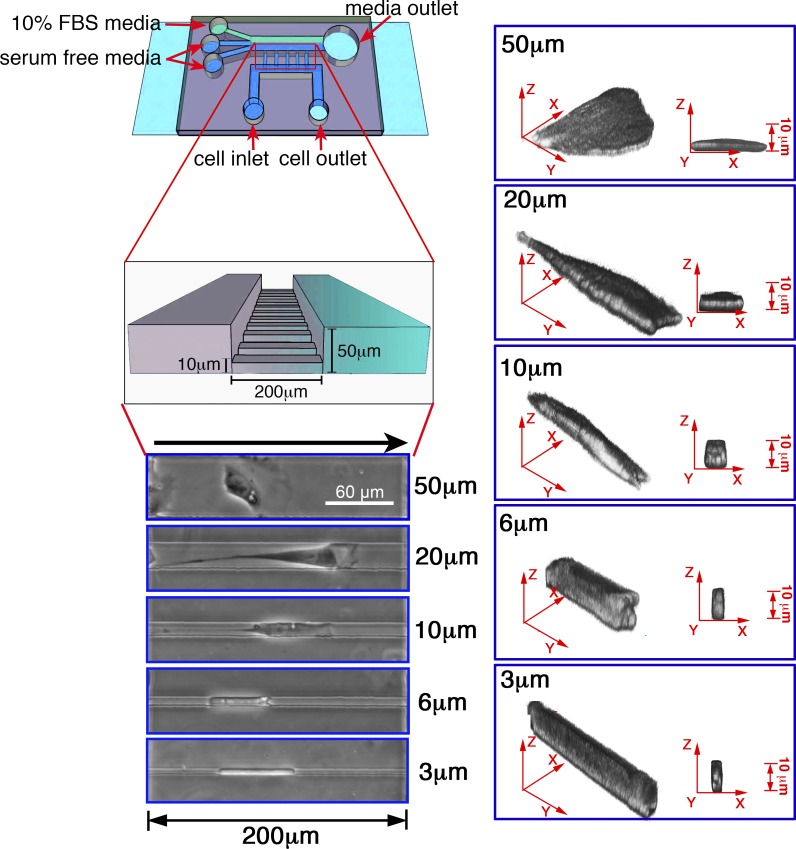
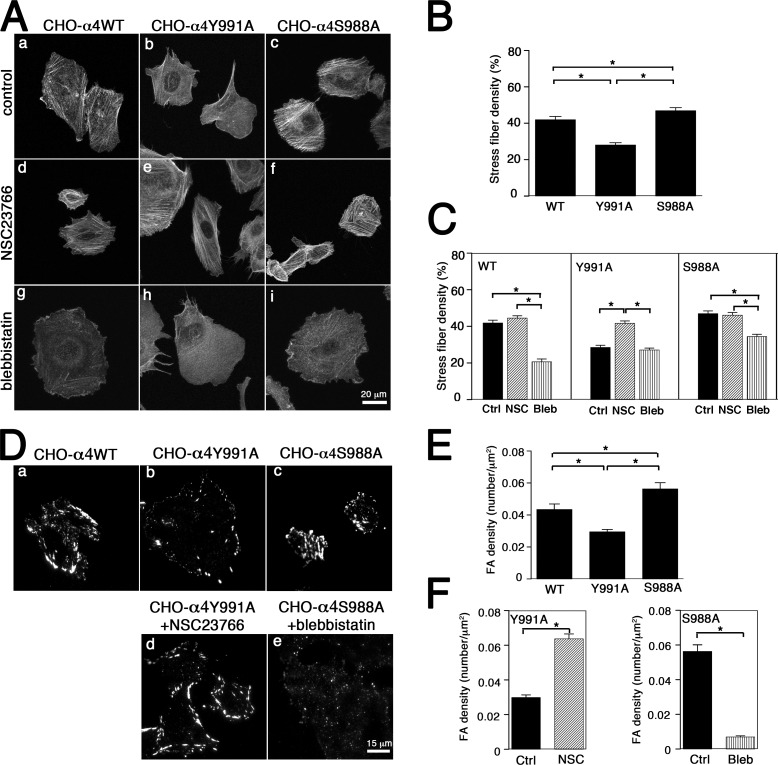
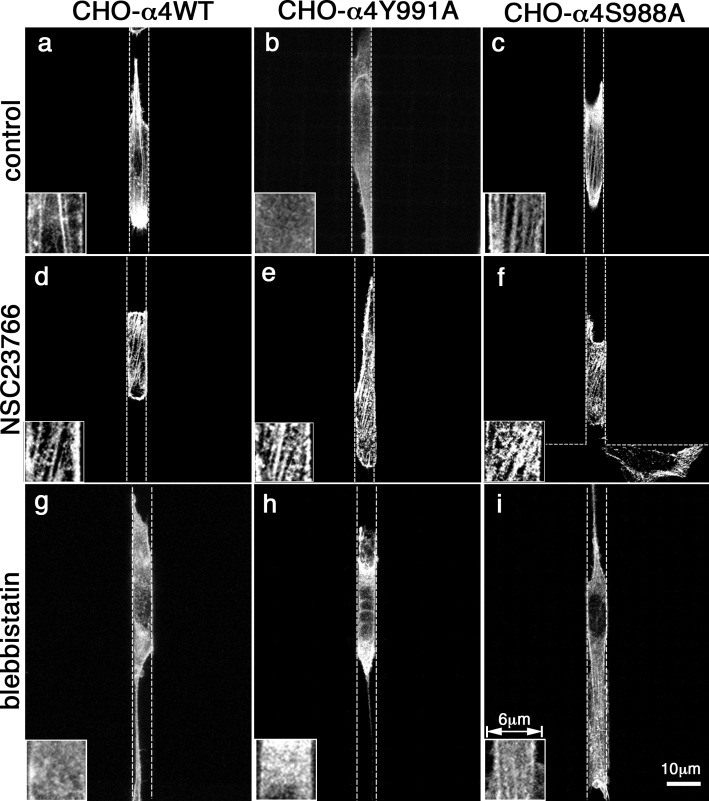
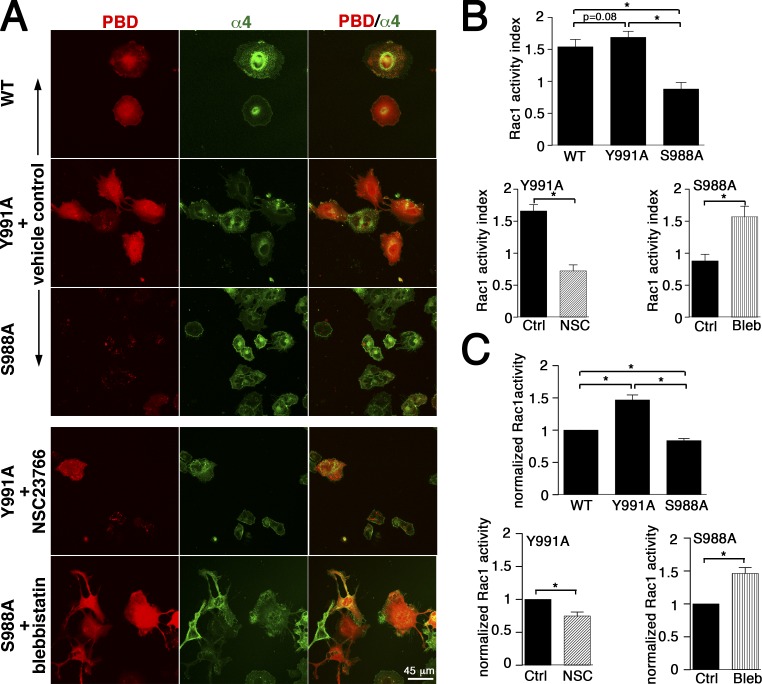
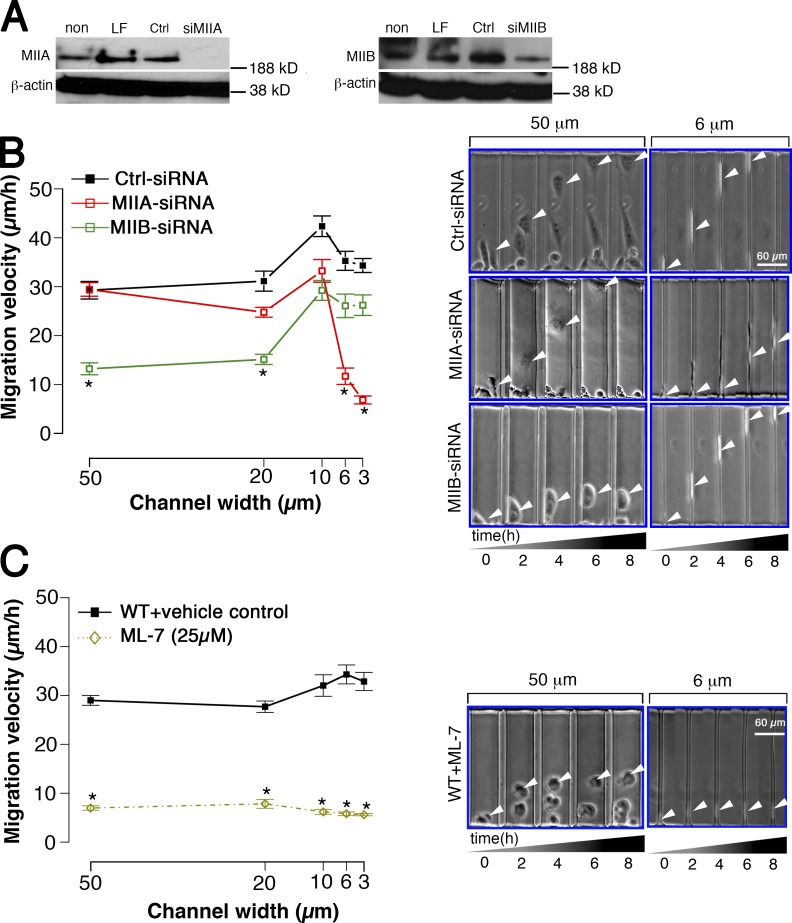
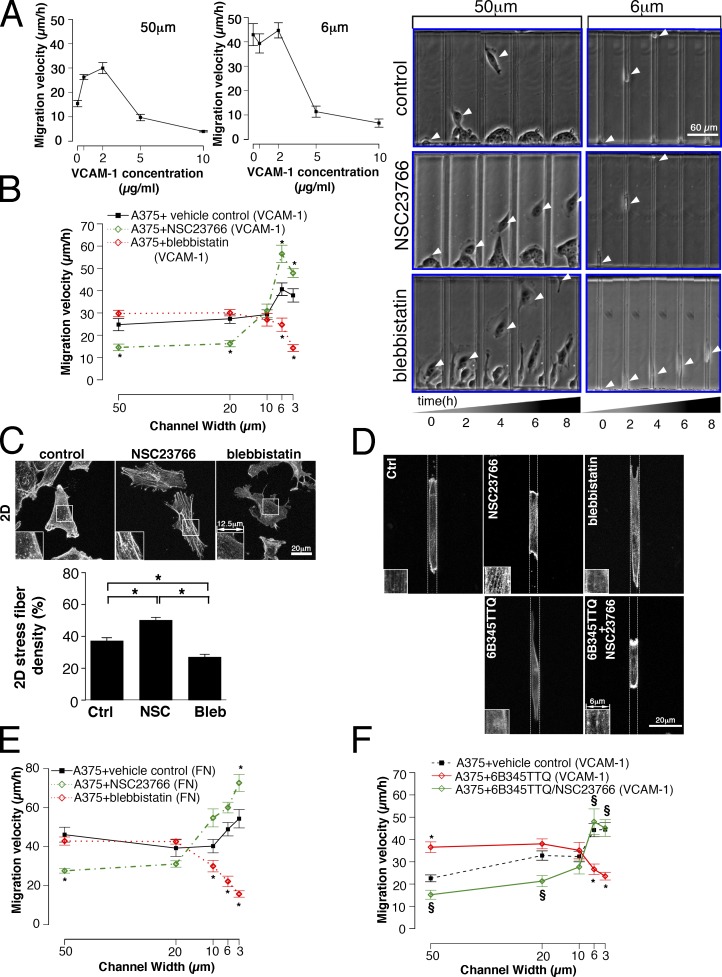
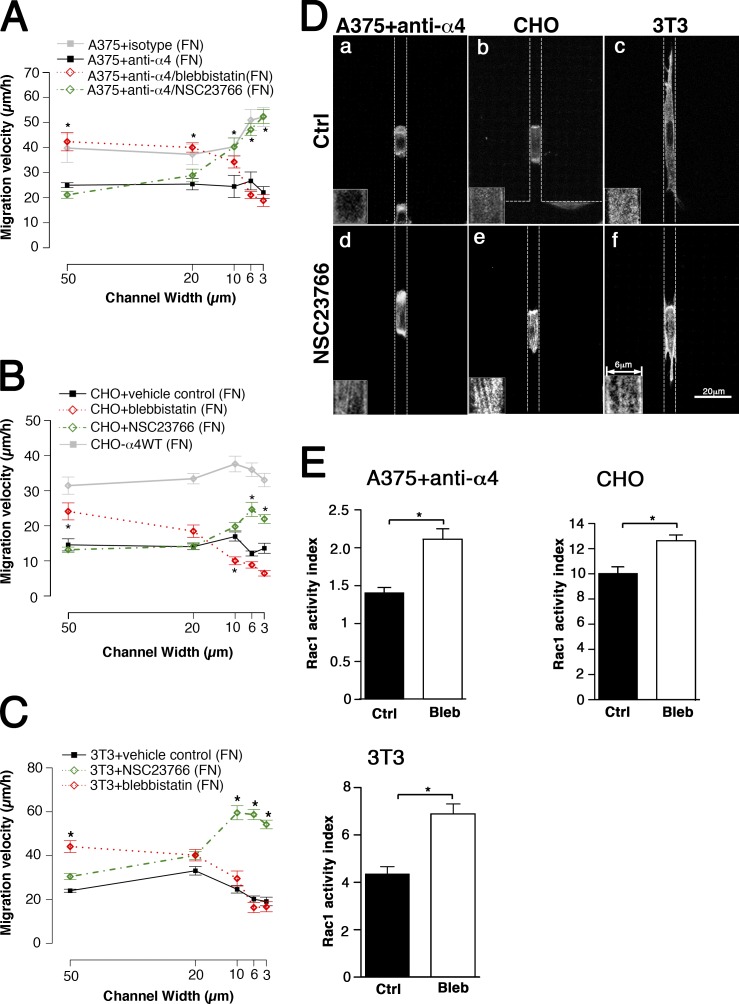
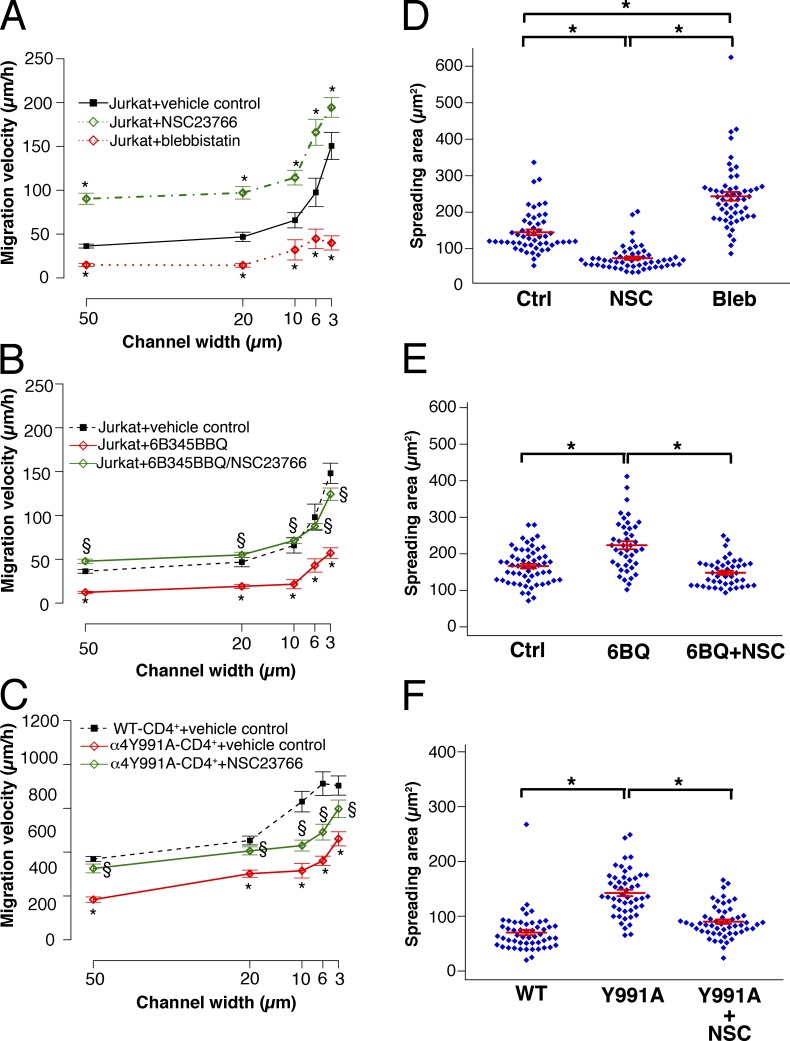
Using a microchannel assay, we demonstrate that cells adopt distinct signaling strategies to modulate cell migration in different physical microenvironments. We studied α4β1 integrin-mediated signaling, which regulates cell migration pertinent to embryonic development, leukocyte trafficking, and melanoma invasion. We show that α4β1 integrin promotes cell migration through both unconfined and confined spaces. However, unlike unconfined (2D) migration, which depends on enhanced Rac1 activity achieved by preventing α4/paxillin binding, confined migration requires myosin II-driven contractility, which is increased when Rac1 is inhibited by α4/paxillin binding. This Rac1-myosin II cross talk mechanism also controls migration of fibroblast-like cells lacking α4β1 integrin, in which Rac1 and myosin II modulate unconfined and confined migration, respectively. We further demonstrate the distinct roles of myosin II isoforms, MIIA and MIIB, which are primarily required for confined and unconfined migration, respectively. This work provides a paradigm for the plasticity of cells migrating through different physical microenvironments.


Figures

Figure 1.
Figure 1.
Overview of the microchannel device. Schematic of the migration chamber bonded to coverslips (light blue), with inlet ports for serum-free media or cells (dark blue) or FBS (10%; green). Also shown is a close-up detailing the dimensions of the microchannel array, along with phase contrast and 3D reconstruction images of CHO-α4WT cells in microchannels of different widths. The black arrow (above the phase images) indicates the direction of migration.
Figure 2.
Figure 2.
Effects of the α4 tail mutations on cell migration in microchannels. (A) The migration speed and velocity of CHO-α4WT, CHO-α4Y991A, and CHO-α4S988A cells through 50- or 6-µm microchannels as a function of VCAM-1–coating concentration. Data represent means ± SEM of >20 cells from three independent experiments. (B and C) The influence of channel width on cell migration velocity through microchannels coated with 1 µg/ml VCAM-1 (B) or 5 µg/ml fibronectin (FN; C). Data represent means ± SEM of >30 cells from three independent experiments. In B, the images of migrating cells in designated channel widths and time points are also shown. White arrowheads show the centroid of cell body. *, P < 0.005 relative to CHO-α4WT.
Figure 3.
Figure 3.
Effects of inhibiting Rac1, ROCK, or myosin II on the migration of CHO-α4WT, CHO-α4Y991A, and CHO-α4S988A cells in microchannels. (A–C) CHO-α4WT (A), CHO-α4Y991A (B), and CHO-α4S988A (C) cells were treated with either the Rac1 inhibitor NSC23766, the ROCK inhibitor Y-27632, the myosin II inhibitor blebbistatin, or vehicle control and allowed to migrate inside VCAM-1–coated channels. Their migration velocities in channels of different widths were quantified. Data represent means ± SEM of >40 cells from three independent experiments. *, P < 0.005 relative to control. The images of migrating cells in designated channel widths and time points are also shown. White arrowheads show the centroid of cell body.
Figure 4.
Figure 4.
Effects of inhibiting Rac1 or myosin II on stress fiber and focal adhesion densities in cells migrating on 2D surfaces. CHO-α4WT, CHO-α4Y991A, or CHO-α4S988A cells were plated on VCAM-1–coated coverslips in the presence of vehicle control (A, a–c; and D, a–c), NSC23766 (A, d–f; and D, d), or blebbistatin (A, g–i; and D, e). (A) Cells were stained with TRITC-conjugated phalloidin and imaged by confocal microscopy. (B and C) Stress fiber density was measured and graphed as the percentage of total cell area occupied by stress fibers in wild experiments. *, P < 0.05 relative to control. (D) Cells were stained with an antibody against pY-paxillin and imaged by TIRF microscopy. (E and F) Focal adhesion density was measured as the number of focal adhesions (FA) per micrometer squared in the absence (E) or presence of NSC23766 for CHO-α4Y991A or blebbistatin for CHO-α4S988A cells (F). Data represent means ± SEM of 45 cells from three independent experiments. *, P < 0.05 relative to control. Ctrl, control.
Figure 5.
Figure 5.
Effects of inhibiting Rac1 or myosin II on stress fiber and focal adhesion densities in cells migrating inside 6-µm channels. CHO-α4WT, CHO-α4Y991A, and CHO-α4Y988A cells were induced to migrate inside 6-µm VCAM-1–coated channels in the presence of vehicle control (a–c), NSC23766 (d–f), or blebbistatin (g–-i). Cells were stained with TRITC-conjugated phalloidin and imaged by confocal microscopy. The boxes at the bottom left corner of each image show an enlarged view highlighting the stress fibers. The dotted lines indicate the PDMS walls of the channel.
Figure 6.
Figure 6.
Effects of Rac1 or myosin II inhibitors on Rac1 activity. (A) CHO-α4WT, CHO-α4Y991A, and CHO-α4S988A cells transfected with RFP-PAK-PBD were plated on VCAM-1 and imaged for GTP-loaded Rac1 (red) and GFP-tagged α4 integrin by dual-color confocal microscopy in the presence of vehicle control, NSC23766 (NSC) for CHO-α4Y991A, or blebbistatin for CHO-α4S988A. (B) Rac1 activity was quantified by measuring the RFP-PAK-PBD red fluorescence intensity for each cell type normalized by GFP-tagged α4 integrin. Data represent means ± SEM of ≥50 cells from two independent experiments. (C) The overall level of GTP-loaded Rac1 was quantified in the presence of vehicle control or indicated treatments using ELISA. Data represent means ± SEM from four independent experiments. *, P < 0.05. Ctrl, control; Bleb, blebbistatin.
Figure 7.
Figure 7.
Effects of MIIA or MIIB depletion on the migration of CHO-α4WT cells in microchannels. (A) CHO-α4WT cells were either transfected with an siRNA for MIIA (a) or MIIB (b), a control (Ctrl) siRNA, with lipofectamine only (LF), or remained untransfected (non). The depletion of either MIIA or MIIB by their corresponding siRNAs was demonstrated by immunoblotting using an anti-MIIA or anti-MIIB antibody. β-Actin served as an internal control. (B) The migration velocities of MIIA- or MIIB-depleted CHO-α4WT cells and siRNA controls were quantified as a function of channel width. (C) The migration velocity of CHO-α4WT cells, treated with either ML-7 or a vehicle control, was measured in channels of different widths. In B and C, all channels were coated with VCAM-1. Data represent means ± SEM of >45 cells from three independent experiments. *, P < 0.005. The images of cells migrating inside 50- or 6-µm microchannels at designated time points are also shown. White arrowheads show the centroid of the cell body.
Figure 8.
Figure 8.
Migration of A375-SM cells in microchannels. (A–F) A375-SM cells were induced to migrate in microchannels coated with VCAM-1 (A–D) or fibronectin (E–F). (A) Migration velocity of A375-SM cells as a function of VCAM-1–coating concentration in 50- and 6-µm microchannels. (B and E) A375-SM cells were treated with NSC23766, blebbistatin, or vehicle control, and their migration velocities in channels of different widths were quantified. In B, the images of cells migrating inside the 50- or 6-µm channels at designated time points are shown. White arrowheads show the centroid of the cell body. (C and D) A375-SM cells were plated on a 2D surface (C) or induced to migrate inside a 6-µm channel (D) in the presence of vehicle control (Ctrl), NSC23766 (NSC), or blebbistatin (Bleb), stained with TRITC-conjugated phalloidin, and imaged by confocal microscopy. The boxes at the bottom left corner of each image show enlarged images of stress fibers. In C, the density of stress fibers was measured and graphed as a percentage of total cell spreading area occupied by stress fibers. In D, the dotted lines indicate the PDMS walls of the channel. Each data (A–E) represent means ± SEM of >40 cells from three independent experiments. *, P < 0.005 (B and E) or P < 0.05 (C). (F) A375-SM cells were treated with the α4/paxillin-binding inhibitor, 6B345TTQ, in the presence of NSC23766 or vehicle control. Cell migration velocities in channels of different widths were quantified. Data represent means ± SEM of >30 cells from two independent experiments for each channel width. *, P < 0.005 relative to control. §, P < 0.005 relative to 6B345TTQ treatment alone. FN, fibronectin.
Figure 9.
Figure 9.
Effects of Rac1 and myosin II inhibitors on the migration of anti-α4–treated A375-SM, CHO cells and 3T3 fibroblasts in microchannels. (A–C) A375-SM cells treated with an anti–α4 integrin antibody or an isotype control (A), CHO cells (B), or 3T3 fibroblasts (C) were incubated with NSC23766, blebbistatin (Bleb), or the vehicle control (Ctrl) and allowed to migrate through microchannels coated with fibronectin (FN). Cell migration velocities in channels of different widths were quantified. CHO-α4WT cells treated with vehicle control were also included for comparison (B). Data represent means ± SEM of >30 cells from at least three independent experiments for each channel width. *, P < 0.005 relative to control. (D) Cells migrating inside 6-µm channels were stained with TRITC-conjugated phalloidin and imaged by confocal microscopy. The boxes at the bottom left corner of each image show enlarged images of stress fibers. The dotted lines indicate the PDMS walls of the channel. (E) Rac1 activity was quantified by measuring the RFP-PAK-PBD red fluorescence intensity for each cell type normalized by FITC intensity from background using dual-color broad-field microscopy. Data represent means ± SEM of ≥85 cells. *, P < 0.05.
Figure 10.
Figure 10.
Effects of Rac 1 and myosin II inhibitors on the migration of Jurkat T and primary CD4+ T cells in microchannels. (A and D) Jurkat T cells were treated with NSC23766 (NSC), blebbistatin (Bleb), or vehicle control (Ctrl). (B and E) Jurkat T cells were treated with the α4/paxillin-binding inhibitor, 6B345TTQ, or vehicle control or treated with 6B345TTQ (6BQ) plus NSC23766 or vehicle control. (C and F) Primary WT-CD4+ or Y991A-CD4+ T cells were treated with vehicle control or NSC23766. Cells were either induced to migrate through channels of different widths (A–C) or plated on a 2D surface (D and E). All surfaces were coated with VCAM-1. Cell migration velocities (A–C) and mean spreading areas (D and E) were quantified. Data represent means ± SEM of >60 cells. *, P < 0.005 relative to control (A and B) or WT-CD4+ T cells (C). §, P < 0.005 compared with the absence of NSC23766.

References

    1. Alexander S., Koehl G.E., Hirschberg M., Geissler E.K., Friedl P. 2008. Dynamic imaging of cancer growth and invasion: a modified skin-fold chamber model. Histochem. Cell Biol. 130:1147–1154 10.1007/s00418-008-0529-1 - DOI - PubMed
    1. Balzer E.M., Tong Z., Paul C.D., Hung W.C., Stroka K.M., Boggs A.E., Martin S.S., Konstantopoulos K. 2012. Physical confinement alters tumor cell adhesion and migration phenotypes. FASEB J. 26:4045–4056 10.1096/fj.12-211441 - DOI - PMC - PubMed
    1. Berlin C., Bargatze R.F., Campbell J.J., von Andrian U.H., Szabo M.C., Hasslen S.R., Nelson R.D., Berg E.L., Erlandsen S.L., Butcher E.C. 1995. alpha 4 integrins mediate lymphocyte attachment and rolling under physiologic flow. Cell. 80:413–422 10.1016/0092-8674(95)90491-3 - DOI - PubMed
    1. Burridge K., Wennerberg K. 2004. Rho and Rac take center stage. Cell. 116:167–179 10.1016/S0092-8674(04)00003-0 - DOI - PubMed
    1. Bustos R.I., Forget M.A., Settleman J.E., Hansen S.H. 2008. Coordination of Rho and Rac GTPase function via p190B RhoGAP. Curr. Biol. 18:1606–1611 10.1016/j.cub.2008.09.019 - DOI - PMC - PubMed

Publication types

MeSH terms