. 2013 Oct;163(2):882-95.
doi: 10.1104/pp.113.221648. Epub 2013 Aug 26.

Antiphase light and temperature cycles affect PHYTOCHROME B-controlled ethylene sensitivity and biosynthesis, limiting leaf movement and growth of Arabidopsis

Affiliations

Antiphase light and temperature cycles affect PHYTOCHROME B-controlled ethylene sensitivity and biosynthesis, limiting leaf movement and growth of Arabidopsis

Ralph Bours et al. Plant Physiol. 2013 Oct.

Abstract

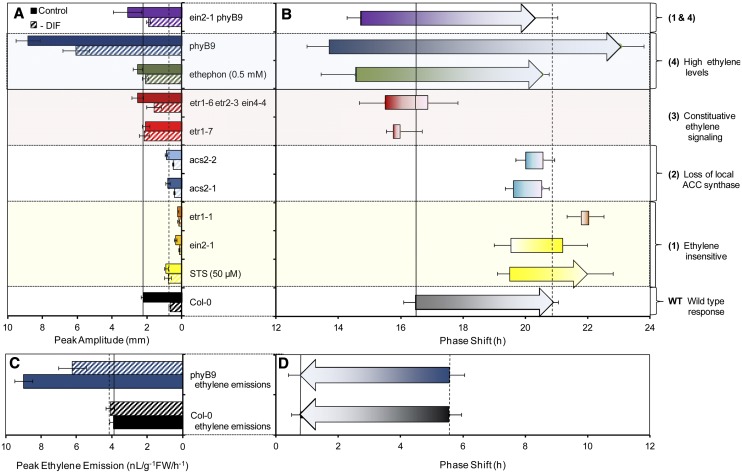
In the natural environment, days are generally warmer than the night, resulting in a positive day/night temperature difference (+DIF). Plants have adapted to these conditions, and when exposed to antiphase light and temperature cycles (cold photoperiod/warm night [-DIF]), most species exhibit reduced elongation growth. To study the physiological mechanism of how light and temperature cycles affect plant growth, we used infrared imaging to dissect growth dynamics under +DIF and -DIF in the model plant Arabidopsis (Arabidopsis thaliana). We found that -DIF altered leaf growth patterns, decreasing the amplitude and delaying the phase of leaf movement. Ethylene application restored leaf growth in -DIF conditions, and constitutive ethylene signaling mutants maintain robust leaf movement amplitudes under -DIF, indicating that ethylene signaling becomes limiting under these conditions. In response to -DIF, the phase of ethylene emission advanced 2 h, but total ethylene emission was not reduced. However, expression analysis on members of the 1-aminocyclopropane-1-carboxylic acid (ACC) synthase ethylene biosynthesis gene family showed that ACS2 activity is specifically suppressed in the petiole region under -DIF conditions. Indeed, petioles of plants under -DIF had reduced ACC content, and application of ACC to the petiole restored leaf growth patterns. Moreover, acs2 mutants displayed reduced leaf movement under +DIF, similar to wild-type plants under -DIF. In addition, we demonstrate that the photoreceptor PHYTOCHROME B restricts ethylene biosynthesis and constrains the -DIF-induced phase shift in rhythmic growth. Our findings provide a mechanistic insight into how fluctuating temperature cycles regulate plant growth.


Figures

Figure 1.
Figure 1.
Rhythmic growth and movement of leaves under control and −DIF conditions. A, Two 36-d-old Arabidopsis (Col-0) rosette plants exposed to −DIF (top) or control (+DIF; bottom) conditions and photographed at the end of the fourth photoperiod. B, Projected oscillations for leaves developing 7 d under control (solid line) or −DIF (dashed line) conditions. se values are depicted per 20-min time point as shading; n = 8 leaves. Gray areas indicate the dark period. C, Closeup of B for day 4, depicting an example of amplitude, phase, and phase shift for control leaves compared with −DIF. Error bars represent se; n = 8. D, Average amplitudes of days 2 to 6 calculated from the projected oscillations in B for leaves developing under control (black bar) or −DIF (gray bar) conditions. Error bars represent se; n = 8. E, The phase of oscillations for leaves developing under −DIF conditions (dashed line, white circles) shifts compared with the control (solid line, black triangles). Error bars represent se; n = 8. [See online article for color version of this figure.]
Figure 2.
Figure 2.
Ethylene signaling controls amplitude and phase of diurnal leaf movement. A, Average amplitudes (days 2–6) calculated from the projected oscillations (in B and C) for leaves treated with mock (gray bar) or 50 µm STS (black bar) and for Col-0 (light gray bar), etr1-1 (black bar), and ein2-1 (dark gray bar) developing under control conditions. Error bars represent se; n = 8. B, Projected oscillations of Col-0 leaves under control conditions treated with 50 µm STS (solid line) compared with mock (dashed line). Error bars represent se; n = 8. Gray areas indicate the dark period. C, Projected oscillations for leaves of etr1-1 (solid black line) and ein2-1 (solid gray line) compared with the Col-0 wild type (black dashed line) under control conditions. Error bars represent se; n = 8. Gray areas indicate the dark period. D, Phase shifts of leaf movements between control and −DIF conditions for leaves treated with mock or 50 µm STS and for Col-0, ein2-1, and etr1-1. Significant phase shifts (P < 0.05) are indicated with arrows, and nonsignificant shifts are indicated with bars. Each arrow depicts the direction and strength of the shift in phase: the start of the arrow indicates average phase during days 2 to 6 under control conditions, and the arrowhead indicates the average phase for −DIF (days 2–6). Error bars represent se; n = 8.
Figure 3.
Figure 3.
Ethylene restores growth and movement under −DIF. A, Average amplitudes of days 2 to 6 calculated from the projected oscillations (in B and C) of leaves treated with mock (white bar), increasing concentrations of ethephon (gray to black bars) and in Col-0 (light gray bar), etr1-7 (black bar), and etr1-6 etr2-3 ein4-4 (gray bar) developing under −DIF conditions. Error bars represent se; n = 8. B, Ethephon dose response of projected oscillations for Col-0 leaves developing on plants sprayed with increasing ethephon concentrations (0.25–1 mm; gray to black lines) compared with mock (0.0 mm; dashed line) at the start (t = 0 h) of −DIF treatment. Error bars represent se; n = 8. Gray areas indicate the dark period. C, Projected oscillations of leaves of the constitutive ethylene signaling mutant etr1-7 (black line) compared with the Col-0 wild type (dashed line) under −DIF conditions. Error bars represent se; n = 8. Gray areas indicate the dark period. D, Phase shifts of leaf movements between control and −DIF conditions for leaves treated with mock or 1 mm ethephon and for Col-0, etr1-7, and etr1-6 etr2-3 ein4-4. Significant phase shifts (P < 0.05) are indicated with arrows, and nonsignificant shifts are indicated with bars. Each arrow depicts the direction and strength of the shift in phase: the start of the arrow indicates average phase during days 2 to 6 under control conditions, and the arrowhead indicates the average phase for −DIF (days 2–6). Error bars represent se; n = 8.
Figure 4.
Figure 4.
Ethylene biosynthesis in the petiole is reduced under −DIF conditions. A, Diurnal ethylene emissions of Col-0 rosette plants growing under control (solid line, black triangles) or −DIF (dashed line, white circles) conditions. Error bars represent se; n ≥ 10. Gray areas indicate the dark period. B, Typical ACS2 promoter activity pattern obtained using histochemical GUS staining in leaves of equal age developed under control or −DIF conditions on 4-week-old plants. C, Promoter activity analysis of ACS2 using histochemical GUS staining in leaves developed during 10 d of control or −DIF conditions in 4-week-old plants. D, Average amplitudes of acs2-1 and acs2-2 leaves developing under control (black bars) or −DIF (gray bars) conditions compared with the Col-0 wild type, calculated from days 2 to 6 of the projected oscillations (in E). Error bars represent se; n = 8. E, Projected oscillations of acs2-1 (dark blue line) and acs2-2 (light blue line) leaves compared with the Col-0 wild type (black dashed line) under control (top) and −DIF (bottom) conditions. Error bars represent se; n = 8. Gray areas indicate the dark period. F, Phase shifts of leaf movement between control and −DIF conditions for acs2-1, acs2-2, and Col-0 wild-type leaves. A significant phase shift (P < 0.05) is indicated with the arrow, and nonsignificant shifts are indicated with bars. The arrow depicts the direction and strength of the shift in phase: the start of the arrow indicates the average phase during days 2 to 6 under control conditions, and the arrowhead indicates the average phase for −DIF (days 2–6). Error bars represent se; n = 8. G, ACC content of acs2-1 and Col-0 wild-type petioles harvested on the peak of ethylene emission (in A) under −DIF or control conditions. Error bars represent se; n = 8. FW, Fresh weight. H, Average amplitudes of days 2 to 6 calculated from the projected oscillations (Supplemental Fig. S4, F and G) of leaves treated with 0.5% (w/w) ACC (dark bars) or mock (light bars) lanolin paste (approximately 1 mg) on the petiole (solid bars) or the leaf blade (dashed bars) under −DIF conditions. Error bars represent se; n = 8. I, Average phase of days 2 to 6 calculated from the projected oscillations (Supplemental Fig. S4, F and G) of leaves treated with 0.5% (w/w) ACC (dark bars) or mock (light bars) lanolin paste (approximately 1 mg) on the petiole (solid bars) or the blade (dashed bars) under −DIF conditions. Error bars represent se; n = 8.
Figure 5.
Figure 5.
−DIF reduces the ethylene sensitivity of Arabidopsis. A, Responses of 5-d-old etiolated Col-0 seedlings to various concentrations of ACC. After 48 h of germination under control or −DIF conditions, seedlings were kept in the dark with temperature cycles for 72 h. B, Hypocotyl lengths of 5-d-old Col-0 wild-type (black lines) or ein2-1 (red lines) seedlings in response to various concentrations of ACC after 48 h of germination under control or −DIF conditions. Seedlings were then kept in the dark with temperature cycles for 72 h on various ACC concentrations. Error bars represent se; n ≥ 60. [See online article for color version of this figure.]
Figure 6.
Figure 6.
PHYB represses ethylene-dependent leaf movement. A and B, Projected oscillations for phyB9 (solid blue line) and Col-0 (dotted black line) leaves developing under control (A) or −DIF (B) conditions. Error bars represent se; n = 8. Gray areas indicate the dark period. C, Average amplitudes of Col-0 and phyB9 leaves developing under control (black bars) or −DIF (gray bars) conditions, calculated from days 2 to 6 of the projected oscillations (in A and B). Error bars represent se; n = 8. D, Phase shifts of leaf movement between control and −DIF conditions for phyB9 and Col-0 wild-type leaves. Significant phase shifts (P < 0.05) are indicated with arrows. Each arrow depicts the direction and strength of the shift in phase: the start of the arrow indicates average phase during days 2 to 6 under control conditions, and the arrowhead indicates the average phase for −DIF (days 2–6). Error bars represent se; n = 8. E and F, Ethylene emissions of phyB9 mutants (blue diamonds, solid lines) compared with Col-0 wild-type emissions (white circles, dashed lines) under control (E) and −DIF (F) conditions. Error bars represent se; n ≥ 10. Gray areas indicate the dark period. FW, Fresh weight. G, Promoter activity analysis of ACS2 using histochemical GUS staining in phyB9 leaves developed during 10 d of −DIF (top) or control (bottom) conditions on 4-week-old plants. H, Relative hypocotyl lengths of 5-d-old phyB9 (solid blue line) or Col-0 wild-type (dotted black line) seedlings in response to various concentrations of ACC. After 48 h of germination under control (triangles) or −DIF (circles) conditions, seedlings were kept in the dark with temperature cycles for 72 h on various ACC concentrations. Absolute lengths (as depicted in Supplemental Fig. S5D) were normalized for the length at 0 µm ACC (100%). Error bars represent se; n = 60.
Figure 7.
Figure 7.
Dissection of leaf movement in the phyB9 ein2-1 double mutant. A, Representative 36-d-old phyB9, ein2-1, and phyB9 ein2-1 rosette plants developing under −DIF conditions at the end of the fourth photoperiod. B, Average amplitudes of phyB9, ein2-1, and phyB9 ein2-1 leaves developing under control (black bars) or −DIF (gray bars) conditions, calculated from days 2 to 6 of the projected oscillations (in C and D). Error bars represent se; n = 8. C and D, Projected leaf oscillations of phyB9, ein2-1, and phyB9 ein2-1 double mutant developing under control (C) or −DIF (D) conditions. Error bars represent se; n = 8. Gray areas indicate the dark period. [See online article for color version of this figure.]
Figure 8.
Figure 8.
Amplitudes and phase shifts of leaf movement and ethylene emission between control and −DIF conditions in mutants and treatments used in this study. A, Averaged amplitudes (measured during days 2–6) of leaf movements. Solid bars mark the wild-type response under control conditions, and dashed lines mark the −DIF wild-type response. Error bars represent se; n = 8. B, Phase shifts of leaf movements between control and −DIF conditions compared with the wild-type (WT) response. Significant phase shifts (P < 0.05) are indicated with arrows, and nonsignificant shifts are indicated with bars. Each arrow depicts the direction and strength of the shift in phase: the start of the arrow indicates average phase during days 2 to 6 under control conditions, and the arrowhead indicates the average phase for −DIF (days 2–6). Error bars represent se; n = 8. C and D, Average peak amplitudes of ethylene emission (C) and phase shifts of ethylene emission (D) between control and −DIF conditions for phyB9 mutants and the Col-0 wild-type. Error bars represent se; n ≥ 10.

References

    1. Bleecker AB, Estelle MA, Somerville C, Kende H. (1988) Insensitivity to ethylene conferred by a dominant mutation in Arabidopsis thaliana. Science 241: 1086–1089 - PubMed
    1. Bours R, Muthuraman M, Bouwmeester H, van der Krol A. (2012) OSCILLATOR: a system for analysis of diurnal leaf growth using infrared photography combined with wavelet transformation. Plant Methods 8: 29. - PMC - PubMed
    1. Cancel JD, Larsen PB. (2002) Loss-of-function mutations in the ethylene receptor ETR1 cause enhanced sensitivity and exaggerated response to ethylene in Arabidopsis. Plant Physiol 129: 1557–1567 - PMC - PubMed
    1. Carvalho SMP, Heuvelink E, Cascais R, van Kooten O. (2002) Effect of day and night temperature on internode and stem length in chrysanthemum: is everything explained by DIF? Ann Bot (Lond) 90: 111–118 - PMC - PubMed
    1. Finlayson SA, Lee IJ, Morgan PW. (1998) Phytochrome B and the regulation of circadian ethylene production in sorghum. Plant Physiol 116: 17–25 - PMC - PubMed

Publication types

MeSH terms

LinkOut - more resources