. 2013 Nov 1;29(21):2705-13.
doi: 10.1093/bioinformatics/btt470. Epub 2013 Aug 24.

Identification of transcription factor binding sites from ChIP-seq data at high resolution

Affiliations

Identification of transcription factor binding sites from ChIP-seq data at high resolution

Anaïs F Bardet et al. Bioinformatics. .

Abstract

Motivation: Chromatin immunoprecipitation coupled to next-generation sequencing (ChIP-seq) is widely used to study the in vivo binding sites of transcription factors (TFs) and their regulatory targets. Recent improvements to ChIP-seq, such as increased resolution, promise deeper insights into transcriptional regulation, yet require novel computational tools to fully leverage their advantages.

Results: To this aim, we have developed peakzilla, which can identify closely spaced TF binding sites at high resolution (i.e. resolves individual binding sites even if spaced closely), as we demonstrate using semisynthetic datasets, performing ChIP-seq for the TF Twist in Drosophila embryos with different experimental fragment sizes, and analyzing ChIP-exo datasets. We show that the increased resolution reached by peakzilla is highly relevant, as closely spaced Twist binding sites are strongly enriched in transcriptional enhancers, suggesting a signature to discriminate functional from abundant non-functional or neutral TF binding. Peakzilla is easy to use, as it estimates all the necessary parameters from the data and is freely available.

Availability and implementation: The peakzilla program is available from https://github.com/steinmann/peakzilla or http://www.starklab.org/data/peakzilla/.

Contact: stark@starklab.org.

Supplementary information: Supplementary data are available at Bioinformatics online.


Figures
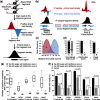
Fig. 1.
Fig. 1.
Peakzilla algorithm. (a) Overview of the ChIP-seq pipeline. TFBSs display a characteristic bimodal distribution of the positive and negative strand reads. (b) Example of a true-positive (Peak A) and false-positive (Peak B) peak in the Twist dataset in D.melanogaster (genomic coordinates chr2L:12420984-12423043 and chrX: 9899747-9905926, respectively). Peak B, unlike peak A, does not exhibit the characteristic double distribution of reads on the positive and negative strands. (c) Read distribution model using two Gaussian distributions. (d) Peak score. While both peaks A and B from (b) show the same enrichment of read count over control, the score for peak B is penalized by the distribution score, a multiplicative factor [0 … 1], as it does not fit to the specific double distribution of the model in (c). (e) Fragment diversity or data non-redundancy. Y-axis denotes the number of genomic positions that contain 90% of the reads that contribute to a peak. Peaks with a distribution score of 0 are more redundant, whereas peaks with a distribution score of 1 are more diverse. The same plot for all peaks in shown in Supplementary Figure S2 (f) Fraction of peaks with a distribution score of 0 or 1 that contain the corresponding TF motif
Fig. 2.
Fig. 2.
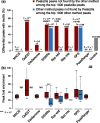
High precision of peakzilla peaks. Analyses performed on the Twist dataset in D.melanogaster. (a) Enrichment of motifs in differential peaks between peakzilla and other methods. Bionomial P-values of enrichment over control and number of differential peaks with a motif are shown on top of the bars. See Supplementary Figure S6 for other datasets and species. (b) Fold enrichment values of differential peaks and associated Wilcoxon P-values (NA: no peak available)
Fig. 3.
Fig. 3.
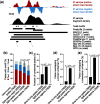
Functionality of multiple peak regions. Analyses performed on the Twist dataset in D.melanogaster. (a) Example of peak split. Peakzilla detects three adjacent peaks, while MACS, QuEST, CisGenome and PeakRanger report a single large peak region, and SISSRs and spp report two peak regions (GPS did not call any peak in that region; we considered all peaks called with standard parameters for each method). (b) Split peaks match motif occurrences. All peakzilla peaks corresponding to a single MACS peak (major: same summit; minor: additional summit) are more highly enriched in Twist motifs than control regions, suggesting that they constitute true independent TFBSs. The same is true for motifs of Snail and Dorsal, which are TFs known to cooperate with Twist. (c) Split peaks are highly conserved. (d) Split peaks are enriched for known enhancers. (e) Split peaks are enriched for mesodermal enhancers
Fig. 4.
Fig. 4.
High resolution of peakzilla. We evaluated the different methods on semisynthetic datasets that contained peak pairs at decreasing peak-to-peak distances (i.e. resolution). For each method, we determined a true-positive rate (TPR; number of correct peak calls divided by the total number of true peaks) and FDR (number of false peak calls divided by the number of total peak calls) and indicate the best resolution reached (in base pairs below each method’s name)
Fig. 5.
Fig. 5.
Application to high-resolution data. (a) Average fragment densities and peak regions from low- (red), medium- (purple) and high-resolution (blue) peaks for Twist (best 1000 peaks of each method). SISSRs, spp and GPS are not shown, as they do not report peak regions but only summit positions. (b) Resolution achieved by the different methods at low- (red), medium- (purple) and high-resolution (blue) as calculated as the minimal peak-to-peak distance (after removing 1% outliers for each method). (c) Average fragment densities and peak regions from ChIP-seq (red) and ChIP-exo (blue) peaks for CTCF (best 1000 peaks of each method; QuEST and PeakRanger cannot be used without a control sample). (d) Resolution of the methods calculated as in (b)

References

    1. Bailey TL, Gribskov M. Combining evidence using p-values: application to sequence homology searches. Bioinformatics. 1998;14:48–54. - PubMed
    1. Bardet AF, et al. A computational pipeline for comparative ChIP-seq analyses. Nat. Protoc. 2012;7:45–61. - PubMed
    1. Berman BP, et al. Exploiting transcription factor binding site clustering to identify cis-regulatory modules involved in pattern formation in the Drosophila genome. Proc. Natl Acad. Sci. USA. 2002;99:757–762. - PMC - PubMed
    1. Boeva V, et al. De novo motif identification improves the accuracy of predicting transcription factor binding sites in ChIP-Seq data analysis. Nucleic Acids Res. 2010;38:e126. - PMC - PubMed
    1. Bonn S, et al. Tissue-specific analysis of chromatin state identifies temporal signatures of enhancer activity during embryonic development. Nat. Genet. 2012;44:148–156. - PubMed

Publication types