Case Reports
. 2013 Sep 10;110(37):14990-4.
doi: 10.1073/pnas.1305999110. Epub 2013 Aug 26.

Mouse model implicates GNB3 duplication in a childhood obesity syndrome

Collaborators, Affiliations
Case Reports

Mouse model implicates GNB3 duplication in a childhood obesity syndrome

Ian S Goldlust et al. Proc Natl Acad Sci U S A. .

Abstract

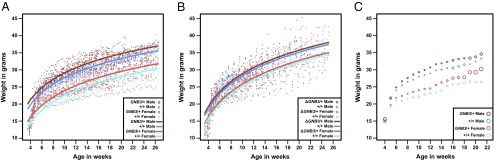
Obesity is a highly heritable condition and a risk factor for other diseases, including type 2 diabetes, cardiovascular disease, hypertension, and cancer. Recently, genomic copy number variation (CNV) has been implicated in cases of early onset obesity that may be comorbid with intellectual disability. Here, we describe a recurrent CNV that causes a syndrome associated with intellectual disability, seizures, macrocephaly, and obesity. This unbalanced chromosome translocation leads to duplication of over 100 genes on chromosome 12, including the obesity candidate gene G protein β3 (GNB3). We generated a transgenic mouse model that carries an extra copy of GNB3, weighs significantly more than its wild-type littermates, and has excess intraabdominal fat accumulation. GNB3 is highly expressed in the brain, consistent with G-protein signaling involved in satiety and/or metabolism. These functional data connect GNB3 duplication and overexpression to elevated body mass index and provide evidence for a genetic syndrome caused by a recurrent CNV.


Conflict of interest statement

The authors declare no conflict of interest.

Figures

Fig. 1.
Fig. 1.
Children with the der(8)t(8;12) exhibit features including a thin upper lip, short nose, periorbital fullness, malar hypoplasia, narrow palpebral fissures, high forehead, and prominent chin. Facial features of subject 1 at (A) 22 mo, (B) 5 y, and (C) 13 y; subject 2 at (D) 4 y, (E) 11 y, and (F) 15 y; subject 3 at (G) 4 y and (H) 11 y; (I) subject 4 at 9 y; (J) subject 6 at 4 y; and (K) subject 7 at 5 y are shown. (L) Pedigrees of 7 families. Filled symbols indicate affected individuals with the unbalanced translocation.
Fig. 2.
Fig. 2.
BMI for (A) male and (B) female subjects. The 5th, 50th, and 95th BMI percentile curves for boys and girls from the Centers for Disease Control and Prevention are plotted. BMI values were calculated using the reported height and weight with a childhood BMI calculator (47).
Fig. 3.
Fig. 3.
Plots of mouse weight by age; (A) 52 (14 GNB3/+ male, 13 +/+ male, 16 GNB3/+ female, and 9 +/+ female mice) and (B) 91 (25 ΔGNB3/+ male, 31 +/+ male, 20 ΔGNB3/+ female, and 15 +/+ female mice) mice were weighed three times a week beginning at weaning. Each dot represents the weight of a single mouse at a given age. Lines indicate predicted mouse weight by age based on presence/absence of the transgene and mouse sex. (C) Weight gain of GNB3/+ and +/+ animals. Circles depict average weekly values of mouse weight ± SEM.
Fig. 4.
Fig. 4.
(A) Gonadal WAT was extracted from 20-wk-old mice (19 GNB3/+ male, 12 +/+ male, 14 GNB3/+ female, and 11 +/+ female mice) and weighed to calculate WAT percent. GNB3/+ WAT percent is significantly greater than +/+ WAT percent in *females (P = 0.0122) and **males (P < 0.0001; Student t test). (B) GNB3 is highly expressed in GNB3/+ brains. Mean Ct values from qRT-PCR of human GNB3, mouse Gnb3, human MLF2, and mouse Mlf2 transcripts in whole brains from eight 8-wk-old male mice are plotted. Data from GNB3/+ and +/+ littermates are shown as solid bars; data from ΔGNB3/+ and +/+ littermates are shown as hatched bars. Lower Ct values correspond to greater gene expression; the absence of Ct data indicates no detection of transcript. All qRT-PCR experiments were performed in triplicate with an internal mouse β-actin (Actb) control. SEM for 40 Actb triplicates was ±0.05 Ct; maximum SEM for other transcripts was ±0.31 Ct.

References

    1. Feinleib M, et al. The NHLBI twin study of cardiovascular disease risk factors: Methodology and summary of results. Am J Epidemiol. 1977;106(4):284–285. - PubMed
    1. Stunkard AJ, Harris JR, Pedersen NL, McClearn GE. The body-mass index of twins who have been reared apart. N Engl J Med. 1990;322(21):1483–1487. - PubMed
    1. Moll PP, Burns TL, Lauer RM. The genetic and environmental sources of body mass index variability: The Muscatine Ponderosity Family Study. Am J Hum Genet. 1991;49(6):1243–1255. - PMC - PubMed
    1. Blakemore AI, Froguel P. Investigation of Mendelian forms of obesity holds out the prospect of personalized medicine. Ann N Y Acad Sci. 2010;1214:180–189. - PubMed
    1. Choquet H, Meyre D. Molecular basis of obesity: Current status and future prospects. Curr Genomics. 2011;12(3):154–168. - PMC - PubMed

Publication types

MeSH terms

Substances

Supplementary concepts