. 2013 Sep 10;110(37):14912-7.
doi: 10.1073/pnas.1310894110. Epub 2013 Aug 26.

Ether lipid generating enzyme AGPS alters the balance of structural and signaling lipids to fuel cancer pathogenicity

Affiliations

Ether lipid generating enzyme AGPS alters the balance of structural and signaling lipids to fuel cancer pathogenicity

Daniel I Benjamin et al. Proc Natl Acad Sci U S A. .

Abstract

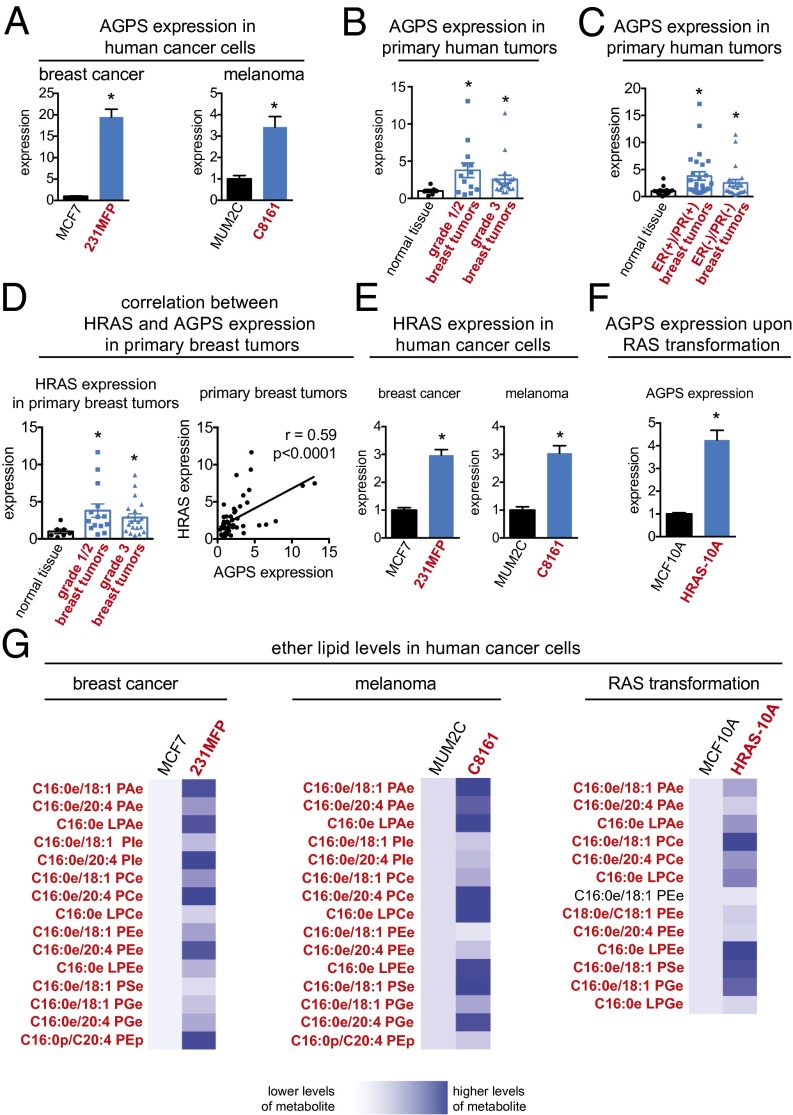
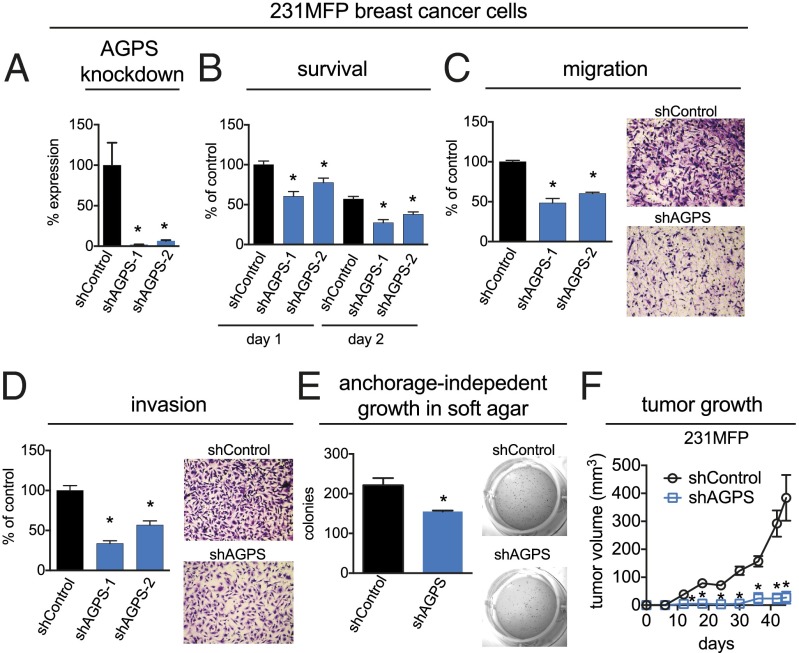
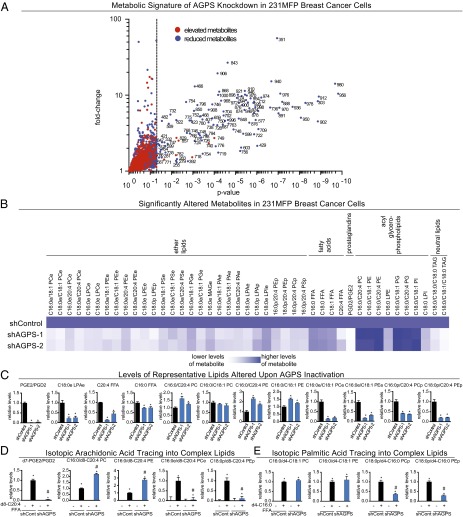
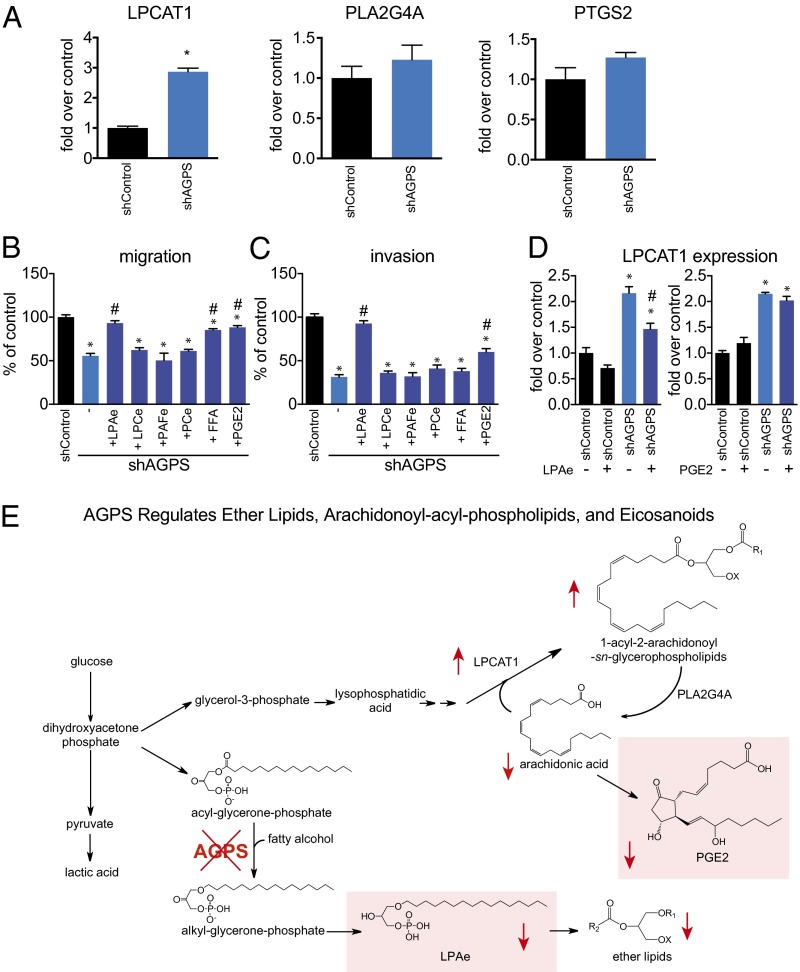
Aberrant lipid metabolism is an established hallmark of cancer cells. In particular, ether lipid levels have been shown to be elevated in tumors, but their specific function in cancer remains elusive. We show here that the metabolic enzyme alkylglyceronephosphate synthase (AGPS), a critical step in the synthesis of ether lipids, is up-regulated across multiple types of aggressive human cancer cells and primary tumors. We demonstrate that ablation of AGPS in cancer cells results in reduced cell survival, cancer aggressiveness, and tumor growth through altering the balance of ether lipid, fatty acid, eicosanoid, and fatty acid-derived glycerophospholipid metabolism, resulting in an overall reduction in the levels of several oncogenic signaling lipids. Taken together, our results reveal that AGPS, in addition to maintaining ether lipids, also controls cellular utilization of fatty acids, favoring the generation of signaling lipids necessary for promoting the aggressive features of cancer.

Keywords: cancer metabolism; eicosanoids; lipid signaling lysophosphatidic acid; metabolomics.


Conflict of interest statement

The authors declare no conflict of interest.

Figures

Fig. 1.
Fig. 1.
AGPS is highly expressed in aggressive cancer cells, primary human tumors, and RAS-transformed cells. (A) AGPS gene expression is heightened across aggressive breast (231MFP) and melanoma (C8161) cancer cells (in red) compared with less aggressive breast (MCF7) and melanoma (MUM2C) cancer cells (in black), as measured by qPCR. (B) AGPS gene expression is significantly higher in Nottingham grade 1 (low-grade) and grade 2 (intermediate-grade), as well as grade 3 (high-grade) primary human breast tumors compared with normal breast tissue as measured by qPCR. (C) AGPS gene expression is also significantly higher in ER(+)/PR(+) and ER(−)/PR(−) human breast tumors compared with normal breast tissue. (D) HRAS expression is higher in grade 1/2 and 3 primary human breast tumors compared with normal breast tissue. HRAS expression from matching normal tissue and breast tumors is significantly correlated with AGPS expression with a Pearson correlation coefficient of r = 0.59. (E) HRAS expression is higher in aggressive breast and melanoma cancer cells compared with less aggressive cells. (F) HRAS overexpression in MCF10A nontransformed mammary epithelial cells increases AGPS expression. (G) Aggressive breast and melanoma cancer cells and HRAS-transformed MCF10A cells possess significantly higher levels of multiple species of ether lipids compared with less aggressive or empty vector-infected MCF10A control cells, respectively. Data in A–F are presented as mean ± SEM; n = 4 per group for A, E, and F, n = 7–26 per group for B–D, and n = 4–5 per group for G. Significance in A–F is presented as *P < 0.05 compared with less-aggressive cancer cells (A and E), normal breast tissue (B–D), or empty vector-infected MCF10A cells (F). Significance in G is presented as P < 0.05 for lipid designations that are bolded in red comparing 231MFP to MCF7, C8161 to MUM2C, or HRAS-10A to MCF10A groups.
Fig. 2.
Fig. 2.
AGPS ablation leads to impairments in breast cancer pathogenicity. (A) AGPS expression was stably knocked down in 231MFP breast cancer cells using two independent shRNA oligonucleotides (shAGPS-1 and shAGPS-2), resulting in >90% reduction in AGPS expression compared with shControl cells determined by qPCR. (B–E) AGPS inactivation in 231MFP cells decreases serum-free cell survival (B), cell migration (C), invasion (D), and anchorage-independent growth in soft-agar (E). Serum-free cell survival was determined by measuring cell viability in serum-free media 24 h after seeding 10,000 cells using a WST cell viability assay. Migration and invasion assays were performed by transferring cancer cells to serum-free media for 4 h before seeding 50,000 cells into inserts with 8-μm pore size containing membranes coated with collagen (10 μg/mL) or BioCoat Matrigel, respectively. Migrated or invaded cells were fixed and stained after 8 h, and these cells were counted over four independent fields of view at 400× magnification and averaged for each biological replicate. For soft-agar assays, 4,000 cells were seeded in agar and colonies were counted by 3-(4,5-dimethylthiazol-2-yl)-2,5-diphenyl tetrazolium bromide (MTT) staining after 4 wk. (F) AGPS knockdown impairs tumor growth in immune-deficient SCID mice compared with shControl cells; 2 × 10⁶ 231MFP cells/100 μL were injected s.c. into the flank of female mice, and tumor growth was measured using calipers. Data are presented as mean ± SEM; n = 3–7 per group. Significance is presented as *P < 0.05 compared with shControl.
Fig. 3.
Fig. 3.
Metabolomic profiling of AGPS knockdown in breast cancer cells reveals widespread alterations in the levels of ether lipids, acylglycerophospholipids, fatty acids, and eicosanoids. (A–C) Metabolomic analyses of AGPS knockdown 231MFP cells compared with shControl cells. (A) AGPS knockdown shows significant (P < 0.05) alterations in the levels of many metabolites. Each point on the volcano plot corresponds to a distinct ion detected in shAGPS-1 and shControl 231MFP cells. Metabolites that are decreasing or increasing in levels on AGPS knockdown are represented as blue and red dots, respectively. The x axis denotes P value of each ion between shAGPS and shControl groups, in which metabolites levels that are significantly altered (P < 0.05) are displayed to the right of the dotted line. The y axis indicates the relative fold-change in the levels of the metabolite between shControl and shAGPS groups. (B) The heat map shows all identified metabolites that are significantly altered in levels (P < 0.05) upon AGPS knockdown in 231MFP cells. These metabolites were quantified by SRM-based targeted metabolomics. Darker blue shading on the heat map corresponds to higher relative levels of metabolite, whereas white or lighter blue shading indicates lower levels. (C) Representative lipids from B are shown as bar graphs. AGPS knockdown not only lowers the levels of ether lipids, but also fatty acids, eicosanoids, and neutral lipids, and raises the levels of several diacylated glycerophospholipids. (D) Targeted metabolomic analysis of isotopic d8-C20:4 FFA (arachidonic acid) incorporation into certain complex cellular lipids. (E) Targeted metabolomic analysis of isotopic d4-C16:0 FFA (palmitic acid) incorporation into certain complex cellular lipids. Data in AE are presented as mean ± SEM; n = 4–5 per group. Significance is expressed in C as *P < 0.05 compared with shControl groups. Significance in D and E is presented as *P < 0.05 between d4-C16:0 FFA and d8-C20:4 FFA groups compared with nonisotopic fatty acid treatment groups, and #P < 0.05 between d4-C16:0 and d8-C20:4 FFA-treated shAGPS vs. matching shControl groups. All raw data for relative levels and absolute levels are shown in Dataset S1. Further quantitative details for LPAe and LPAp lipids are shown in Fig. S3. The metabolomic profile of AGPS inactivation in C8161 melanoma cells is provided in Fig. S4, and the metabolomic profile of AGPS overexpression in MCF7 and MUM2C cells is provided in Fig. S5.
Fig. 4.
Fig. 4.
AGPS fuels cancer pathogenicity in breast cancer cells through altering fatty acid utilization to favor the generation of oncogenic signaling lipids. (A) AGPS knockdown results in altered levels of not only ether lipids, but also reduced levels of fatty acids and eicosanoids and increased levels of acylglycerophospholipids. This may be due to heightened acyltransferase or reduced phospholipase or cyclooxygenase activity. AGPS ablation results in a significant increase in the expression of lysophosphatidyl choline acyltransferase 1 (LPCAT1) without significantly altering the expression of cytosolic phospholipase A2 (PLA2G4) or cyclooxygenase 2 (PTGS2), as determined by qPCR. (B and C) The migratory (B) and invasive (C) impairments in shAGPS 231MFP cells are significantly rescued upon treatment of cells with low concentrations (100 nM) of C18:0e LPA, PGE2, and C16:0 FFA, but not other ether lipids such as C16:0e LPCe, C16:0e/C20:4 PCe, and C16:0e PAFe. Treatment with the aforementioned lipids was initiated concurrently with the seeding of cells for assessment of cancer cell migration (8 h) and invasion (24 h). (D) Treatment with C18:0e LPAe (100 nM), but not PGE2 (100 nM), significantly rescued the heightened expression of LPCAT1 conferred by AGPS knockdown, as assessed by qPCR. (E) Model depicting the metabolic role of AGPS in exerting control over ether lipid metabolism, fatty acid metabolism, and glycerophospholipid metabolism. We show that AGPS knockdown in 231MFP breast cancer cells leads to reduced levels of ether lipids, including the oncogenic LPAe signaling lipid (boxed in red), as well as an alteration in arachidonic acid utilization toward membrane phospholipids through LPAe-mediated LPCAT1 up-regulation, at the expense of generating oncogenic prostaglandins (boxed in red). R1 denote acyl or alkyl chains and X refers to lipid head-group such as phosphocholine, phosphoethanolamine, or phosphate. Data are presented as mean ± SEM; n = 3 per group. Lipid rescue of migratory and invasive impairments on AGPS knockdown in C8161 melanoma cells and C18:0 LPA rescue experiments are provided in Fig. S6. Significance is represented as *P < 0.05 compared with shControl and #P < 0.05 compared with DMSO-treated shAGPS groups.

References

    1. Vander Heiden MG, Cantley LC, Thompson CB. Understanding the Warburg effect: The metabolic requirements of cell proliferation. Science. 2009;324(5930):1029–1033. - PMC - PubMed
    1. Benjamin DI, Cravatt BF, Nomura DK. Global profiling strategies for mapping dysregulated metabolic pathways in cancer. Cell Metab. 2012;16(5):565–577. - PMC - PubMed
    1. Menendez JA, Lupu R. Fatty acid synthase and the lipogenic phenotype in cancer pathogenesis. Nat Rev Cancer. 2007;7(10):763–777. - PubMed
    1. Louie SM, Roberts LS, Nomura DK. Mechanisms linking obesity and cancer [published online ahead of print March 5, 2013] Biochim Biophys Acta. 2013 doi:10.1016/j.bbalip.2013.02.008. - PMC - PubMed
    1. Snyder F, Wood R. Alkyl and alk-1-enyl ethers of glycerol in lipids from normal and neoplastic human tissues. Cancer Res. 1969;29(1):251–257. - PubMed

Publication types