Review
. 2013 Sep;9(9):1441-70.
doi: 10.1166/jbn.2013.1642.

Entering the era of nanoscience: time to be so small

Affiliations
Review

Entering the era of nanoscience: time to be so small

Vuk Uskoković. J Biomed Nanotechnol. 2013 Sep.

Abstract

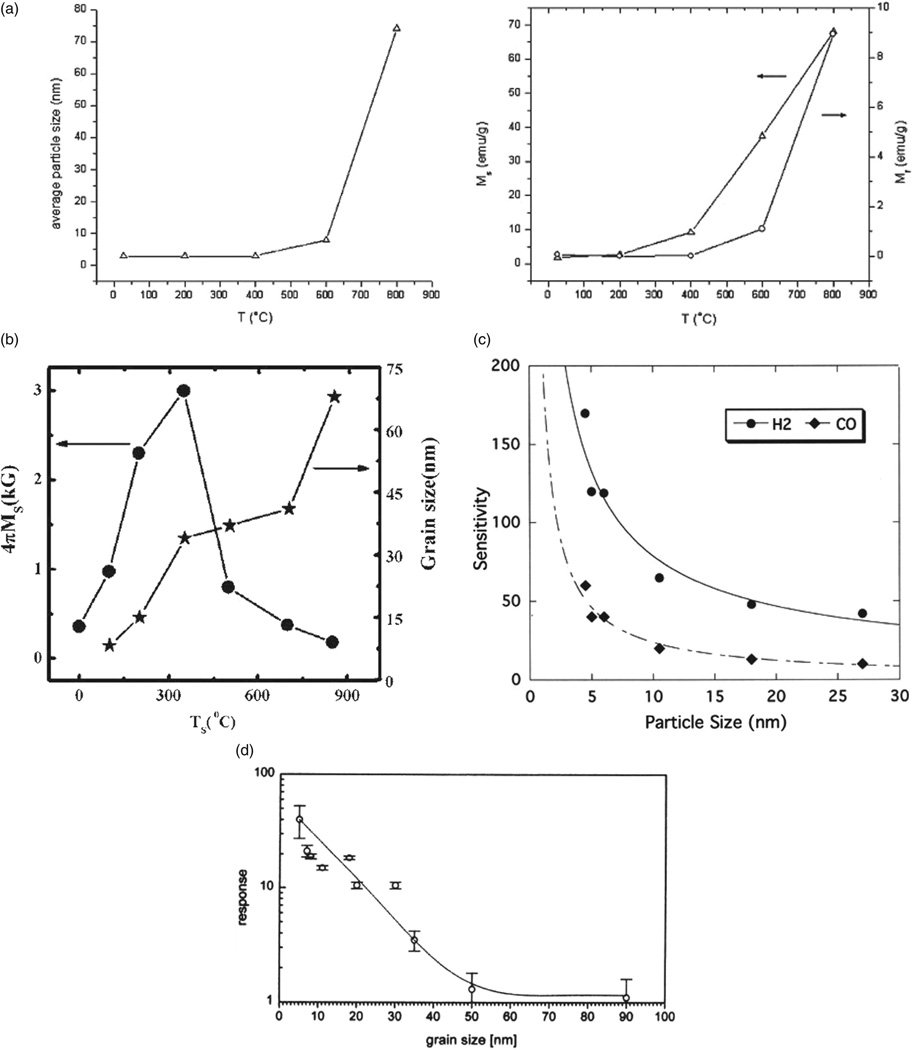
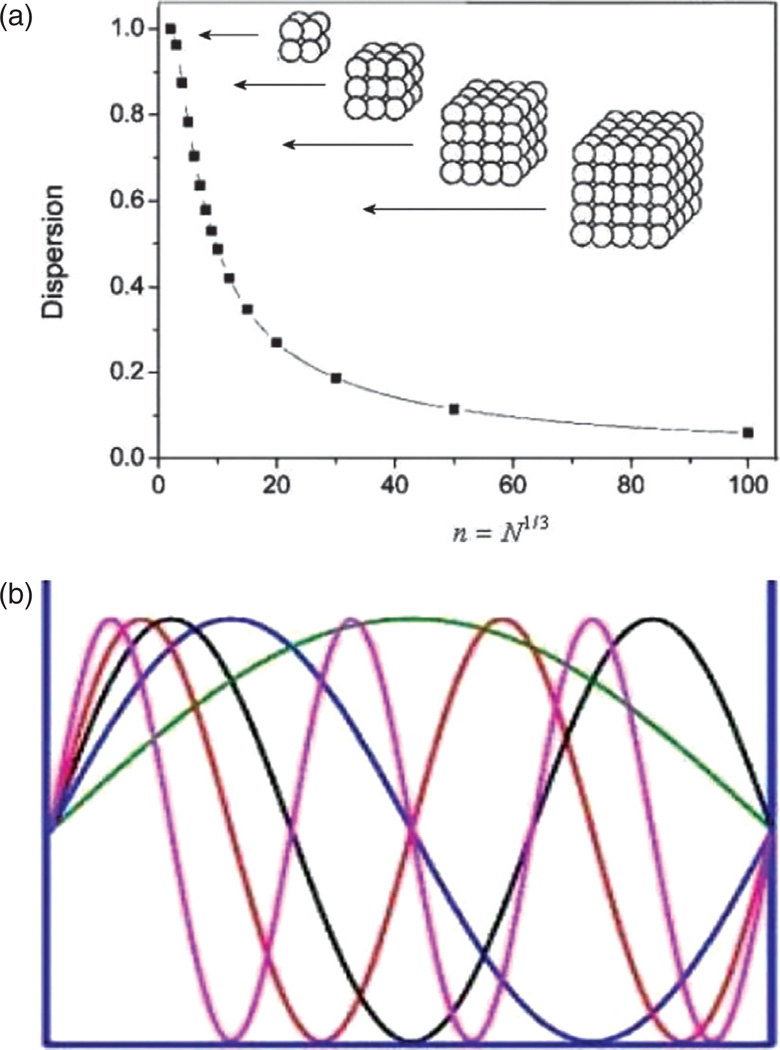
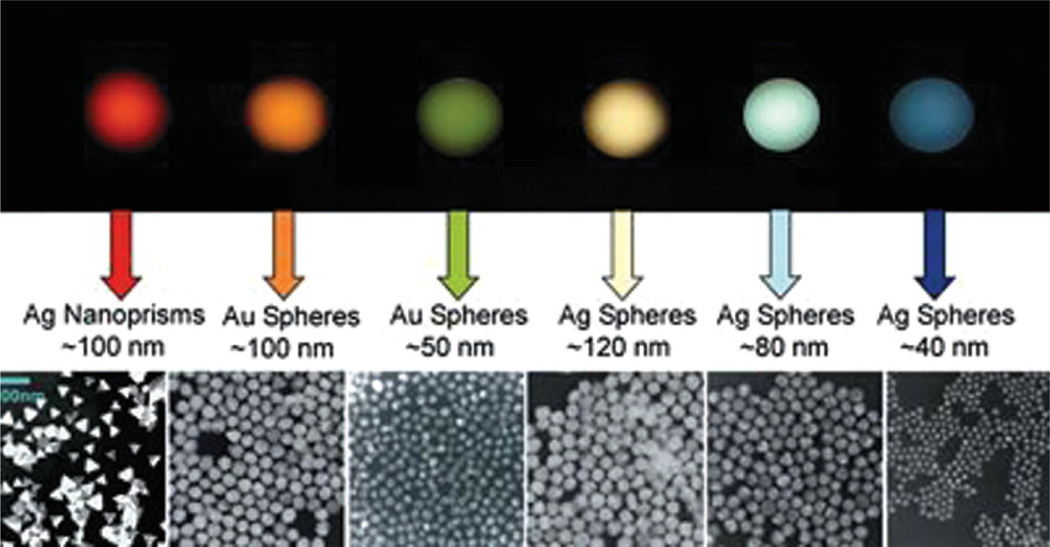
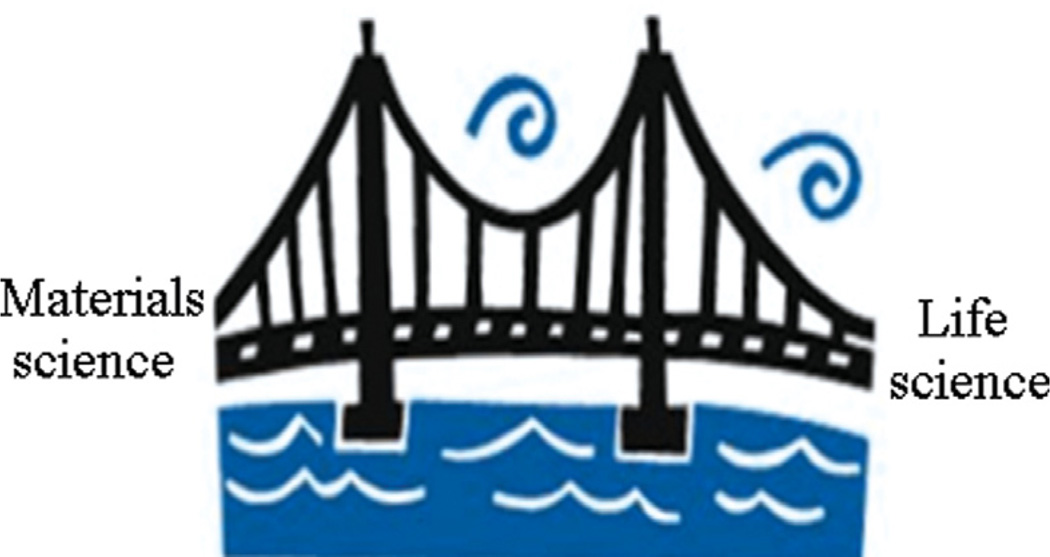
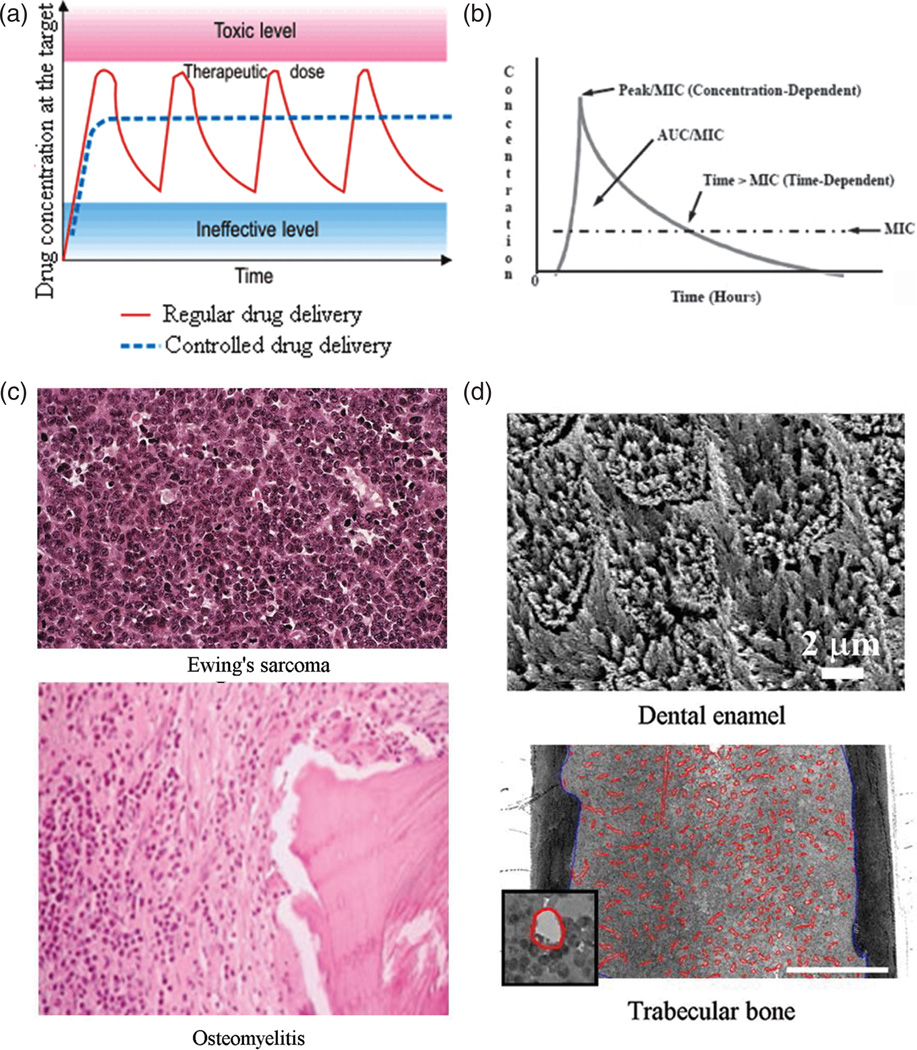
The field of nanoscience has produced more hype than probably any other branch of materials science and engineering in its history. Still, the potentials of this new field largely lay undiscovered ahead of us; what we have learnt so far with respect to the peculiarity of physical processes on the nanoscale is only the tip of an iceberg. Elaborated in this critical review is the idea that the surge of interest in physical chemistry of phenomena at the nanoscale presents a natural consequence of the spatial refinement of the human ability to controllably manipulate the substratum of our physical reality. Examples are given to illustrate the sensitivity of material properties to grain size on the nanoscale, a phenomenon that directly contributed to the rise of nanoscience as a special field of scientific inquiry. Main systemic challenges faced by the present and future scientists in this field are also mentioned. In part, this perspective article resembles standing on the constantly expanding seashore of the coast of nanoscience and nanoengineering and envisioning the parts of the island where the most significant advances may be expected to occur and where, therefore, most of the attention of scientist in this field is to be directed: (a) crossing the gap between life science and materials science; (b) increasing experimentation sensitivity; (c) crisscrossing theory and experiments; and (d) conjoining top-down and bottom-up synthetic approaches. As for materials and the application areas discussed, a special emphasis is placed on calcium phosphate nanoparticles and their usage in controlled drug delivery devices and other applications of biomedical relevance. It is argued that the properties of nanoparticles as drug carriers often comprise the critical determinant for- the efficacy of the drug therapy. Therefore, the basic properties of nanoparticles to be optimized for the purpose of maximizing this efficacy are discussed: size, size distribution, morphology, polymorphic nature, crystallinity, biocompatibility, biodegradability, drug elution profiles, and aggregation propensity.


Figures

Figure 1
Figure 1
Critical length scales for some of the key inventions from the history of humanity. A shift across this scale towards ever smaller dimensions paralleled the advancement of humanity from the stone age to the modern age. Hence, as the products of the most sophisticated technologies of the day progressed from prehistoric huts, cutting tools and garments to modern musical instruments, automobiles and mechanical clocks to computers, nanocopters and nanomotors, the critical lengths shifted from millimeter to micrometer to nanometer scale, respectively.
Figure 2
Figure 2
(a) A hypothetic curve illustrating deviation (—) from a theoretically predicted dependence of a physical quantity on the particle size of a material (- - -) once the latter enters the domain of nanosizes (< 100 nm); (b) hardness or strength of a material as a function of normalized grain size, demonstrating the deviations of experimentally obtained values from those predicted by the Hall-Petch law at sufficiently low, sub-100-nm grain sizes. Reprinted with permission from [5], C. S. Pande and K. P. Cooper, Nanomechanics of hall-petch relationship in nanocrystalline materials. Progress Mat. Sci. 54, 689 (2009). © 2009, Elsevier.
Figure 3
Figure 3
(a) The melting point of Al2O3-Cr2O3 alloy as a function of Cr2O3 content and the particle size; (b) the melting point of indium as a function of the particle size for two different preparation procedures; (c) the phase diagram for a germanium-based alloy and two different particle sizes—54 and 32 nm; (d) local density of states, a measure of the band gap, decreasing in direct proportion to the particle volume and indicating a metal-insulator transition atV≈ 0.01–1 nm in case of three different metals: Au, Cd and Ag, but not Pd. Reprinted with permissions from [6], L. H. Liang, et al., Size-dependent continuous binary solution phase diagram. Nanotech. 14, 438 (2003). © 2003, IOP Publishing; From [7], K. Lu and Z. H. Jin, Melting and superheating of low-dimensional materials. Curr. Op. Solid State Mat. Sci. 5, 39 (2001). © 2001, Elsevier; From [8], E. A. Sutter and P. W. Sutter, Size-dependent phase diagram of nanoscale alloy drops used in vapor-liquid-solid growth of semiconductor nanowires. ACS Nano 4, 4943 (2010). © 2010, American Chemical Society.
Figure 4
Figure 4
The particle size effect on: (a) the resistivity of nanostructured Nb films at different temperatures (the scale on the left corresponds to the films withd≥ 8 nm and the scale on the right to the films with d < 8 nm); (b) the resistivity of the same material at 10 and 300 K; (c) specific conductivity of CaO as a function of the grain size; (d) specific conductivity of Gd-doped CeO2 as a function of the grain boundary surface area per unit mass. Reprinted with permissions from [9], S. Bose, et al., Size induced metal insulator transition in nanostructured Niobium thin films: Intragranular and intergranular contributions. J. Phys: Condens. Matt. 18, 4553 (2006). © 2006, IOP Publishing; From [10], H. L. Tuller, Ionic conduction in nanocrystalline materials. Solid State Ionics 131, 143 (2000). © 2000, Elsevier; From [11], A. Tschöpe, et al., Grain size-dependent electrical conductivity of polycrystalline cerium oxide I: Experiments. Solid State Ionics 139, 255 (2001). © 2001, Elsevier.
Figure 5
Figure 5
The parallel increase in nickel–zinc ferrite particle size ((a), left), saturation magnetization ((a), right, left Y -axis) and remanence ((a), right, right Y -axis) with an increase in the annealing temperature, indicative of ferromagnetic-tosuperparamagnetic transition that entails a drop in the particle size below circa 5 nm; magnetization and particle size of zinc ferrite thin films as a function of the substrate temperature, indicative of the paramagnetic-to-ferromagnetic transition following the transformation of the material from bulk to nanosized form (b); the effect of particle size on sensitivity of SnO2 (c) and In2O3 sensors (d) in detecting CO/H2 (a) and NO2 gases. Reprinted with permissions from [16], V. Uskokovic´ and M. Drofenik, Synthesis of lanthanum-strontium manganites by oxalate-precursor co-precipitation methods in solution and in reverse micellar microemulsion. J. Magn. Magn. Mater. 303, 214 (2006). © 2006, Elsevier; From [17], M. Bohra, et al., Large room temperature magnetization in nanocrystalline zinc ferrite thin films. Appl. Phys. Lett. 88, 262506 (2006). © 2006, American Institute of Physics; From [18], N. Yamazoe, New approaches for improving semiconductor gas sensors. Sensors Actuators B: Chem. 5, 7 (1991). © 1991, Elsevier; From [19], A. Gurlo, et al., Grain size control in nanocrystalline In2O3 semiconductor gas sensors. Sensors Actuators B: Chem. 44, 327 (1997). © 1997, Elsevier.
Figure 6
Figure 6
(a) Dispersion as a measure of the percentage of atoms located on the particle surface as a function of the number of atoms comprising the particle; (b) quantum confinement effect illustrated on standing waves that fit within a resonance box only in specific wavelengths.
Figure 7
Figure 7
Gold nanoparticles whose color is defined by their size and shape, demonstrating that size-dependent properties are the clue to the tremendous potential of nanoscale objects. Reprinted with permission from [20], Retrieved from http://www.discovernano.northwestern.edu/whatis/index_html/sizematters_html (2012). © 2012, Northwestern University.
Figure 8
Figure 8
A bridge joining the coasts of materials science and life science on which some of the most exciting research in the field of nanoscience is about to take place.
Figure 9
Figure 9
Percentage of depolarized adenocarcinomic human alveolar basal epithelial cells (A549) after incubation with micro- and nano-particles of different chemical composition. Reprinted with permission from [28], H. L. Karlsson, et al., Size-dependent toxicity of metal oxide particles—A comparison between nano- and micrometer size. Toxicol. Lett. 188, 112 (2009). © 2009, Elsevier.
Figure 10
Figure 10
Nanosized spherical particles of calcium phosphate (left) acting as subunits in microscopic blocks of material (right) formed by aggregation during desiccation of the powder.
Figure 11
Figure 11
Comparison of the release of a 376 Da organic molecule, fluorescein, from calcium phosphate nanoparticles (○) and their agglomerates (●) shown in Figure 10. While non-aggregated particles exhibit burst release of the entire amount of the drug in a short span of time, the agglomerated ones display a more sustained release thereof.
Figure 12
Figure 12
An example of biocompatible magnetic nanoparticles with biomedical application: hyperthermia cancer therapy. By controlling the stochiometry of the given manganite compound (La1-xSrxMnO3+δ(0.16 < x < 0.5)), its Neel point, equivalent to the maximal temperature achievable due to relaxation energy losses in alternate magnetic field, could be varied and optimized for the given therapy (mild hyperthermic or more intensive thermoblastic, e.g.).
Figure 13
Figure 13
SEM images of polylactide-co-glycolide spheres encapsulating a vinyl sulfone cysteine proteinase inhibitor, aggregated and partially coalesced without PVA as a dispersant (a) and at [PVA] = 1 wt% (c), and narrowly dispersed at [PVA] = 0.5 wt% (b).
Figure 14
Figure 14
SEM images of silicon-nanowire-coated silicon microbeads applicable as oral drug delivery carriers due to their ability to (a) adhere onto epithelial surface of the intestine by entwining with microvilli on the cell surface and (b) open the tight junction spacing in-between individual cells and enhance paracellular transport of the drug the particles are loaded with via the capillary effect.
Figure 15
Figure 15
FITC-tagged silicon-nanowire-coated silica beads adhering onto the epithelial monolayer of Caco-2 cells; yellow color appears only where red-stained ZO-1 molecules of the tight junction and green-stained drug overlap, indicating the paracellular transport of the drug from the apical to the basolateral side of the epithelium. The cell nucleus is stained in blue.
Figure 16
Figure 16
(a) The release of bovine serum albumin (BSA) as a function of time for amorphous (ACP) and nanocrystalline calcium phosphate (HAP); (b) XRD patterns confirming the amorphous and nanocrystalline nature of the two powders.
Figure 17
Figure 17
(a) A curve showing the typical drug concentration at the target site as a function of time during repetitive drug administration in high dosages (red line) in comparison with the ideal therapeutic dose achievable through sustained release from drug-loaded carriers (blue intercepted line); (b) The drug concentration peak and period during which it stays above the MIC, two parameters important to optimize depending on the nature of the antibiotic drug: concentration- or time-dependent; (c) Histological slides showing greater pervasiveness of abnormal tissue in Ewing’s sarcoma, a form of bone cancer, compared to osteomyelitis where infection is more localized, advances as a front and is demarcated by the white line composed of leukocytes; (d) SEM image of dental enamel, an example of a nonvascular hard tissue, 98 wt% of which is composed of calcium phosphate, and an optical micrograph of trabecular bone, the most vascular hard tissue, with blood vessels outlined in red (the scale bar represents 0.5 mm). Reprinted with permission from [121], R. Quintilliani, Pharmacokinetics/pharmacodynamics for critical care clinicians. Crit. Care Clin. 24, 335 (2008). © 2008, Elsevier; From [122], S. L. Ellis, et al., The relationship between bone, hemopoietic stem cells, and vasculature, Blood 118, 1516 (2011). © 2011, American Society of Hematology.
Figure 18
Figure 18
Mpemba effect states that even though the temperature of cold water reaches the freezing point faster than the warm water when cooled under the same conditions, warm water will be the one to freeze faster.
Figure 19
Figure 19
Cholesterol particles prepared using 2-propanol of laboratory grade (a) and technical grade (b) as the solvent.
Figure 20
Figure 20
A “nano” train showing how synthesis of new materials, evaluation of their properties, their processing and integration into components and then assembly into consumer products with a specific performance are all interconnected.
Figure 21
Figure 21
(a) A protein inside of a reverse micelle; (b) an empirically derived plot of the adiabatic compressibility of cytochrome c, lysozyme and lactoglobulin, indicative of the dimensions and tertiary structure of the protein, as a function of parameterwthe molar ratio between the amount of water and the amount of surfactant in the microemulsion, directly proportional to the size of reverse micelle; (c) a blue shift in the absorbance of water in the microwave range induced by a decrease in the size of nanoscopic water pools of reverse micelles, along with (d) the number of water molecules in reverse micelles of the given size. Reprinted with permission from [206], D. Valdez, et al., Hydration and protein folding in water and in reverse micelles: compressibility and volume changes. Biophys. J. 80, 2751 (2001). © 2001, Elsevier; From [207], D. E. Moilanen, et al., Confinement or properties of the interface? dynamics of nanoscopic water in reverse micelles, J. Am. Chem. Soc. 129, 14311 (2007). © 2007, American Chemical Society.
Figure 22
Figure 22
(a) Hypothetic release curves for a drug delivery device under two different measurement regimens: daily replacements of a comparatively small volume of the solvent (-●-), and the usage of a considerably larger solvent volume, with no daily replenishments thereof (-▲-); (b) A disparity between the prediction of global market share of nanotechnologies in 2009 made by the National Science Foundation five years earlier and the true value estimated in 2011. Source: BCC Research Reports 2005 and 2011.

Similar articles

Cited by

References

    1. Uskoković V. Nanomaterials and nanotechnologies: Approaching the crest of this big wave. Curr. Nanosci. 2008;4:119.
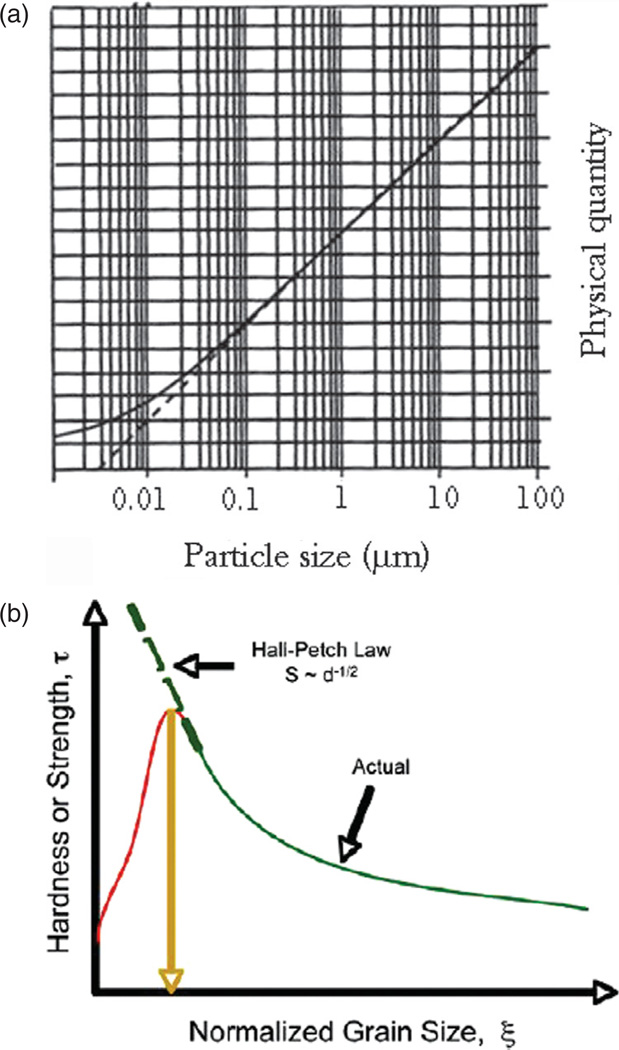
    1. Chokski AH, Rosen A, Karch J, Gleiter H. On the validity of the Hall-Petch relationship in nanocrystalline materials. Scripta Metall. 1989;23:1679.
    1. Andrievski RA. Fundamentals of nanostructured materials: Possibilities and problems. Moscow: BINOM; 2012.
    1. Etheridge ML, Campbell SA, Erdman AG, Haynes CL, Wolf AM, McCullough J. The big picture on nanomedicine: The state of investigational and approved nanomedicine products. Nanomed. Nanotech. Bio. Med. 2013;9:1. - PMC - PubMed
    1. Pande CS, Cooper KP. Nanomechanics of Hall-Petch relationship in nanocrystalline materials. Progress Mat. Sci. 2009;54:689.

Publication types

MeSH terms

LinkOut - more resources