. 2013;3(5):523-35.
doi: 10.1089/brain.2013.0154.

FATCAT: (an efficient) Functional and Tractographic Connectivity Analysis Toolbox

Affiliations

FATCAT: (an efficient) Functional and Tractographic Connectivity Analysis Toolbox

Paul A Taylor et al. Brain Connect. 2013.

Abstract

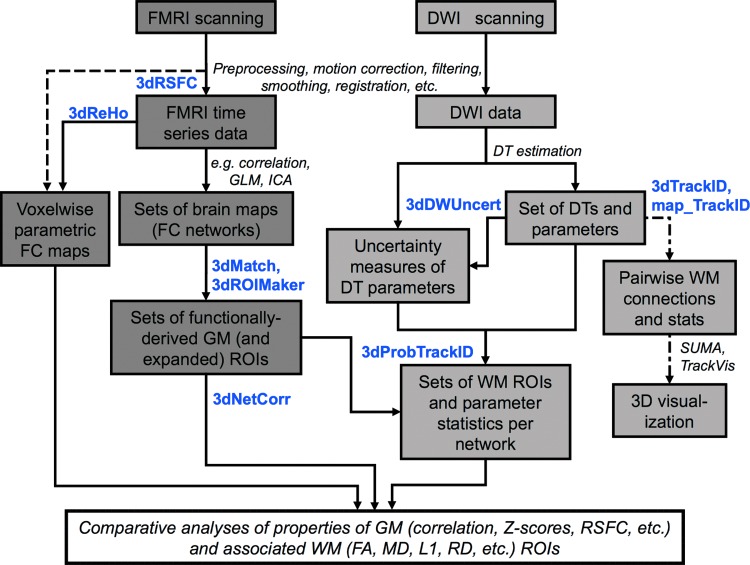
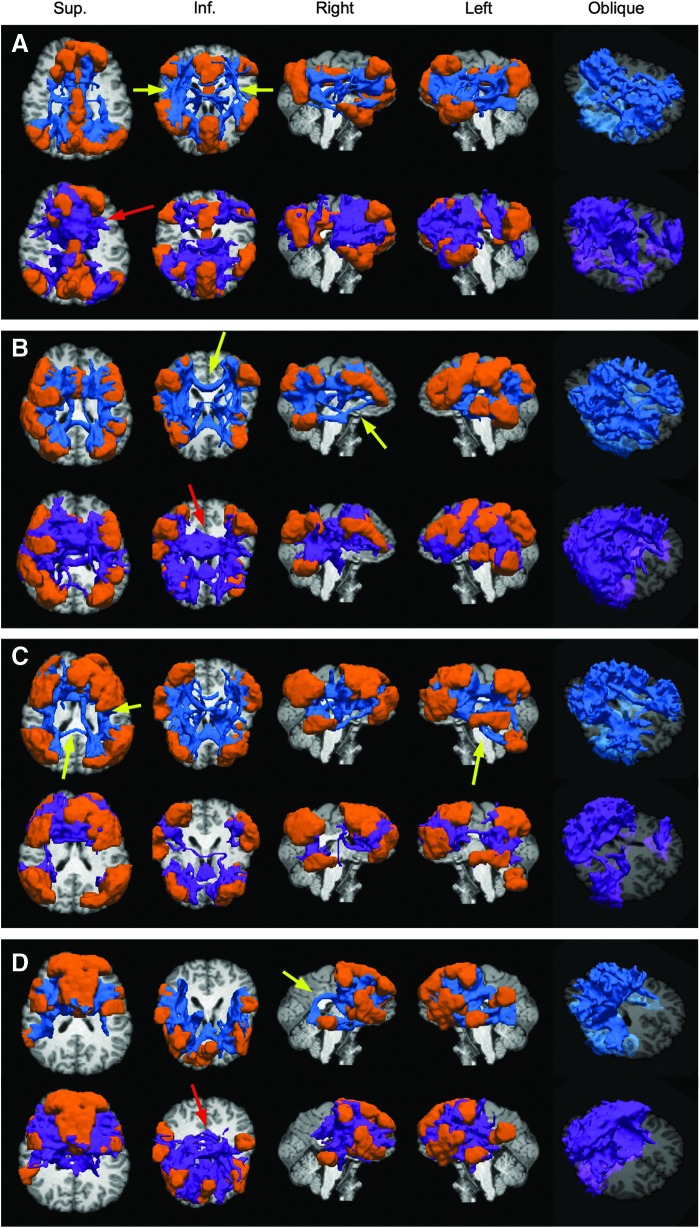
We present a suite of software tools for facilitating the combination of functional magnetic resonance imaging (FMRI) and diffusion-based tractography from a network-focused point of view. The programs have been designed for investigating functionally derived gray matter networks and related structural white matter networks. The software comprises the Functional and Tractographic Connectivity Analysis Toolbox (FATCAT), now freely distributed with AFNI. This toolbox supports common file formats and has been designed to integrate as easily as possible with existing standard FMRI pipelines and diffusion software, such as AFNI, FSL, and TrackVis. The programs are efficient, run by commandline for facilitating group processing, and produce several visualizable outputs. Here, we present the programs and their underlying methods, and we also provide a test example of resting-state FMRI analysis combined with tractography. Tractography results are compared with existing methods, showing significantly reduced runtime and generally similar connectivity, but with important differences such as more circumscribed tract regions and more physiologically identifiable paths produced between several region-of-interest pairs. Currently, FATCAT uses only diffusion tensor-based tractography (one direction per voxel), but higher-order models will soon be included.


Figures

FIG. 1.
FIG. 1.
Schematic of a set of stages of combined functional magnetic resonance imaging (FMRI) (dark gray boxes) and diffusion tensor imaging (DTI)-tractography (light gray boxes) analyses, highlighting the possible use of Functional and Tractographic Connectivity Analysis (FATCAT) programs (bold, blue) and showing additional steps in available software (italics).
FIG. 2.
FIG. 2.
Representation (two dimensional with M=12) of estimating DTI parameter confidence intervals using the jackknife resampling technique. (1) Initial DW measures are obtained, from which (1b) full estimates of the diffusion tensor (DT) and associated parameters are made. For the jackknife process, (2) a random subset of MJ<M measures are selected, from which (3) a sample tensor D* is calculated, as well as (4) its associated parameters. Steps (2–4) are repeated a large number NJ times to create a jackknifed pseudopopulation for each parameter, from which (5) percentile ranges can be found directly from ordering the data set, or from using a Gaussian approximation of the distribution. The latter method is applicable to DTI results and implemented in FATCAT for the sake of efficiency.
FIG. 3.
FIG. 3.
Four components from independent component analysis (ICA) of RS-FMRI time series overlaid on a T1-weighted anatomical mapped to diffusion-weighted imaging space. Networks were identified with Functional Connectome Project (FCP) group ICs: (A) default mode network (DMN); (B) FCP 20, containing the L-R inferior and superior parietal lobules, middle temporal gyri and the medial and medial frontal gyri; (C) FCP 11, the frontoparietal network; and (D) FCP 17, the cingular gyrus, L-R superior frontal gyri and middle frontal gyri. Z-score maps of each IC are shown (left column of each panel) with images thresholded at Z>0. Also shown are corresponding, inflated regions of interest (ROIs) that are created using 3dROIMaker (colors independent per panel). Initial clusters were thresholded to have >130 voxels, and inflation was stopped at a white matter (WM) skeleton defined to be wherever fractional anisotropy (FA) >0.2.
FIG. 4.
FIG. 4.
Deterministic tractography results using 3dTrackID with target ROIs shown in Figure 3A. Tracks are displayed using TrackVis, with a T1 image (mapped to DW-native space) as background. In the top row, tracks through any target ROI (OR logic) are shown, and in the bottom row, only tracks passing through pairs of ROIs (pairwise AND logic) are shown.
FIG. 5.
FIG. 5.
A comparison of WM regions connecting gray matter (GM) ROIs using deterministic (top panels) and probabilistic (bottom panels) tractography for networks A and C (shown in Fig. 3). Approximate locations of GM ROIs are shown with yellow dashes. The deterministic results are a subset of the probabilistic results (here, unthresholded), which shows significantly greater numbers and volumes of WM. Images are in DW-native space.
FIG. 6.
FIG. 6.
Examples of uncertainty values across brain slices, as estimated with jackknife resampling using 3dDWUncert. Distinct differences in GM and WM are evident, as well as the qualitative difference in first eigenvector uncertainty along the different degrees of freedom.
FIG. 7.
FIG. 7.
A comparison of probabilistic tractography results for 3dDWUncert+3dProbTrackID (blue) and FSL's bedpostX+probtrackX (purple). Networks of ROIs (orange) were made using ICA of RS-FMRI data, thresholding results at Z=3.0, and then inflating the GM ROIs using 3dROIMaker (each panel A-D represents the same network of ROIs shown the respective panel of Fig. 3; see caption and text for descriptions). Similar tracking options were used for both programs (FA >0.2, angular deflection <60°, 1 propagation direction per voxel, 5000 iterations). Tracking results show broadly similar connectivity, with generally more circumscribed WM track regions found by 3dProbTrackID, which also tended to find connections between more ROIs. Tracking was performed in DW-native space, in which images are shown.
FIG. 8.
FIG. 8.
An example set of matrices of functional and structural analyses for network A (the DMN; Fig. 3), as determined using 3dProbTrackID. In the top row are correlation matrices of average time series of GM ROIs in the network (ROI labels have been ignored in this example). In the middle rows, standard DTI parameters are given, representing the mean values in the WM regions connecting the targets. Finally, the number of voxels in the final WM regions and the number of tracts found during the probabilistic tractography are given in the fourth row.

Similar articles

Cited by

References

    1. Alhamud A. Tisdall MD. Hess AT. Hasan KM. Meintjes EM. van der Kouwe AJW. Volumetric Navigators for Real-Time Motion Correction in Diffusion Tensor Imaging. Magn Reson Med. 2012;68:1097–1108. - PMC - PubMed
    1. Anderson AW. Measurement of fiber orientation distributions using high angular resolution diffusion imaging. Magn Reson Med. 2005;54:1194–1206. - PubMed
    1. Basser PJ. Mattiello J. LeBihan D. MR diffusion tensor spectroscopy and imaging. Biophys J. 1994;66:259–267. - PMC - PubMed
    1. Basser PJ. Inferring microstructural features and the physiological state of tissues from diffusion-weighted images. NMR Biomed. 1995;8:333–344. - PubMed
    1. Basser PJ. Pajevic S. Pierpaoli C. Duda J. Aldroubi A. In vivo tractography using DT-MRI data. Magn Reson Med. 2000;44:625–632. - PubMed

Publication types

MeSH terms

LinkOut - more resources