. 2013 Nov;14(11):871-82.
doi: 10.1111/obr.12065. Epub 2013 Aug 27.

Variation in the heritability of body mass index based on diverse twin studies: a systematic review

Affiliations

Variation in the heritability of body mass index based on diverse twin studies: a systematic review

J Min et al. Obes Rev. 2013 Nov.

Abstract

Objectives: Over the past three decades, twin studies have shown variation in the heritability of obesity. This study examined the difference of body mass index (BMI) heritability (BMI-H) by population characteristics, such as sex, age, time period of observation and average BMI, as well as by broad social-environmental factors as indicated by country-level gross domestic product (GDP) per capita and GDP growth rate.

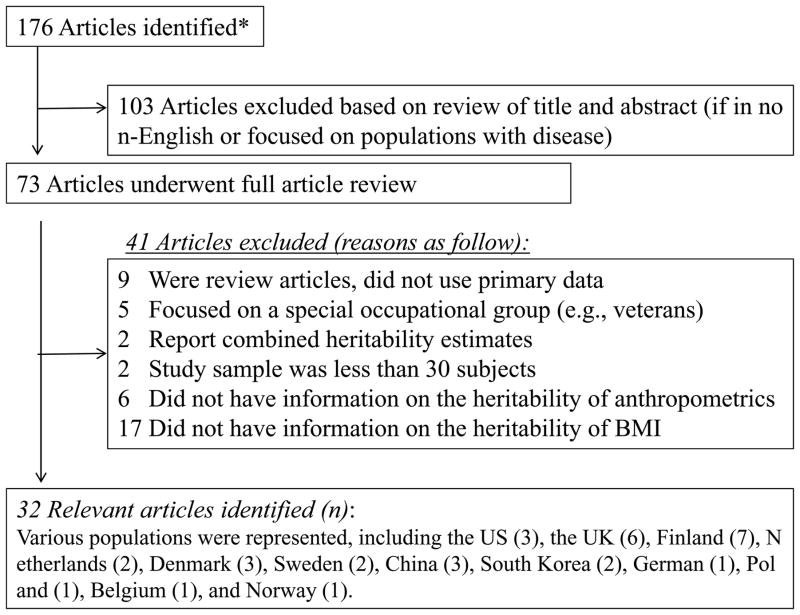
Methods: Twin studies that reported BMI-H and were published in English from January 1990 to February 2011 after excluding those with disease, special occupations or combined heritability estimates for country/ethnic groups were searched in PubMed. 32 studies were identified from Finland (7), the United Kingdom (6), the United States (3), Denmark (3), China (3), Netherlands (2), South Korea (2), Sweden (2) and four from other countries. Meta-regression models with random effects were used to assess variation in BMI-H.

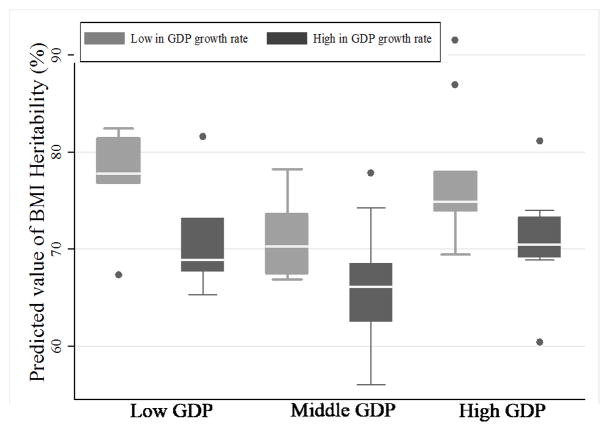
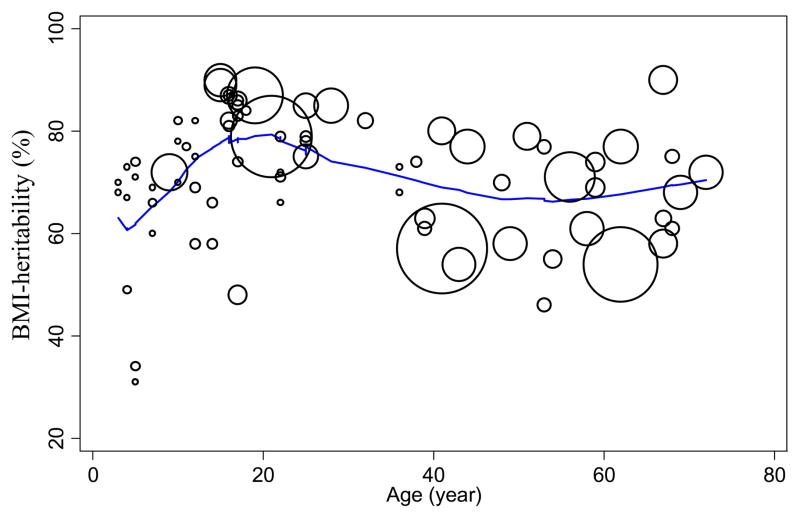
Results: Heterogeneity of BMI-H is significantly attributable to variations in age (<20, 20-55 and ≥56 years), time period of observation (i.e. year of data collection), average BMI and GDP (≤$20,000, $20,001-26,000 and >$26,000). BMI-H was higher in adolescents (<20 years), in studies done in past years, and in populations with higher average BMIs or higher GDP per capita (≥$26,000) than their counterparts. Consistent lowering effects of high GDP growth rate (>median) on BMI-H were shown through stratified analyses by GDP. BMI-H was lower in countries of mid-level GDP, particularly those experiencing rapid economic growth.

Conclusions: BMI-H is sensitive to age, time period of observation, average BMI, GDP and rapid economic growth.

Keywords: Body mass index; GDP; heritability; twin study.


Conflict of interest statement

Conflict of interest: The authors report no conflict of interest.

Figures

Figure 1
Figure 1. The combined effects of GDP and GDP growth rates on BMI-heritability: Findings of pooled analysis based results from 32 twin studies
Predicted values of BMI-heritability were modeled by several predictors in Table 2. As described in the Methods section, studies were classified into one of three groups according to their level of GDP per capita: countries with GDP levels below $20,000 were referred to as the low GDP group (n=16 studies), those between $20,000 and $25,999 were referred to as the middle GDP group (n=28), and those above $26,000 were referred to as the high GDP group (n=22). Studies were further characterized as having either a low or high GDP growth rate within their GDP strata. Within each strata, studies with growth rates higher than the median growth rate were considered as high GDP growth rate countries and those below the median value were considered as low GDP growth rate countries. The median values were 1.80 in the low GDP group, 3.41 in middle GDP group, and 2.44 in the high GDP group. Finally, the number of studies for each combination of GDP and GDP growth rate in our study were as follows: low GDP-low GDP growth rate (n =5), low-high (11), middle-low (7), middle-high (21), high-low (10), high-high (12). The mean level of BMI-heritability was significantly different (p <0.001) across the six groups according to ANOVA tests. This was evident between the Low-Low and the Middle-High groups as well as the Middle-High and the High-Low groups given Scheffé post-hoc tests.
Appendix 1
Appendix 1. Literature search flowchart and results
*PubMed was searched for articles published between January 1, 1990, and February 18, 2011, with following keywords in combination with specific field tags, such as [mh] for MeSH terms and [tiab] for “title and abstract”: “twin”, “twin study”, “heritability”, “body mass index”, “BMI”, “body weight*”, “waist”, “hip”, “body fat mass”, “fat”, “obesity”, “overweight”, and “adiposity”.
Appendix 2
Appendix 2. Bubble plot of BMI-heritability against age using the LOWESS method, based on overall heritability estimates from all 32 twin studies
The effect of age on BMI-heritability is described by this bubble plot using the locally weighted scatterplot smoothing (LOWESS) method for regression to create a non-parametric smoothing curve. The size of the circles reflects the weight of the study (where the weighting factor was equivalent to study sample size). The curve increased until around age 20 (β =1.55, SE =0.39, p <0.001) and peaked in early adulthood (age 20). BMI-heritability at age 20 was 79%. Then, the heritability curve decreased steadily until the mid-50’s (β =-0.47, SE =0.16, p <0.01; BMI-heritability at age 55 was 66%), and then gradually increased afterwards, though not significantly so (β =0.15, SE =0.57, p =0.80).

References

    1. Egger G, Swinburn B, Islam FM. Economic growth and obesity: an interesting relationship with world-wide implications. Economics and human biology. 2012;10(2):147–53. - PubMed
    1. Fernandez-Rhodes L, Demerath EW, Cousminer DL, et al. Association of Adiposity Genetic Variants With Menarche Timing in 92,105 Women of European Descent. American journal of epidemiology. 2013 - PMC - PubMed
    1. Bogardus C. Missing heritability and GWAS utility. Obesity (Silver Spring) 2009;17(2):209–10. - PMC - PubMed
    1. Rampersaud E, Mitchell BD, Pollin TI, et al. Physical activity and the association of common FTO gene variants with body mass index and obesity. Archives of internal medicine. 2008;168(16):1791–7. - PMC - PubMed
    1. Corella D, Arnett DK, Tucker KL, et al. A high intake of saturated fatty acids strengthens the association between the fat mass and obesity-associated gene and BMI. The Journal of nutrition. 2011;141(12):2219–25. - PMC - PubMed

Publication types