

Caesarean delivery and subsequent pregnancy interval: a systematic review and meta-analysis
- PMID: 23981569
- PMCID: PMC3765853
- DOI: 10.1186/1471-2393-13-165
Caesarean delivery and subsequent pregnancy interval: a systematic review and meta-analysis
Abstract
Background: Caesarean delivery has increased worldwide, however, the effects on fertility are largely unknown. This systematic review aims to compare subsequent sub-fertility (time to next pregnancy or birth) among women with a Caesarean delivery to women with a vaginal delivery.
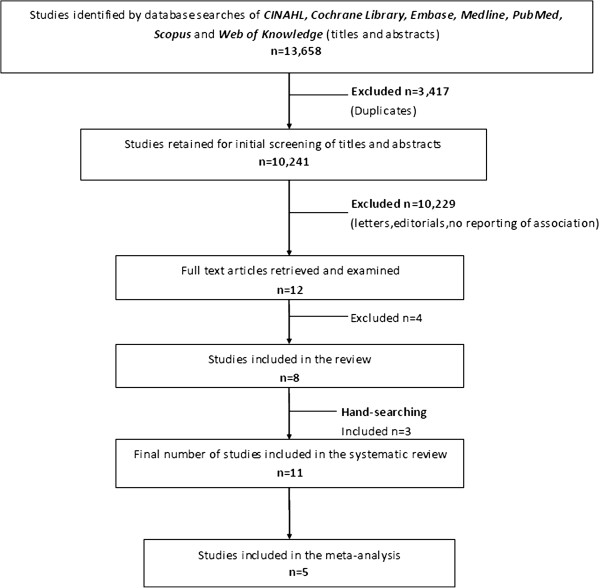
Methods: Systematic review of the literature including seven databases: CINAHL; the Cochrane Library; Embase; Medline; PubMed; SCOPUS and Web of Knowledge (1945 - October 2012), using detailed search-strategies and reference list cross-checking. Cohort, case-control and cross-sectional studies were included. Two assessors reviewed titles, abstracts, and full articles using standardised data abstraction forms and assessed study quality.
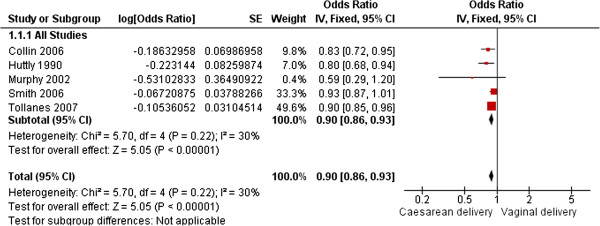
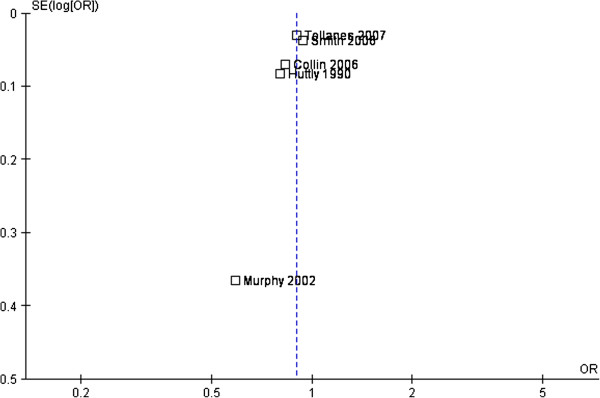
Results: 11 articles were eligible for inclusion in the systematic review, of these five articles which adjusted for confounders were combined in a meta-analysis, totalling 750,407 women using fixed-effect models. Previous Caesarean delivery was associated with an increased risk of sub-fertility [pooled odds ratio (OR) 0.90; 95% CI 0.86, 0.93]. Subgroup analyses by parity [primiparous women: OR 0.91; 95% CI 0.87, 0.96; not limited to primiparous women: OR 0.81; 95% CI 0.73, 0.90]; by publication date (pre-2000: OR 0.80, 95% CI 0.68, 0.94; post-2000: OR 0.90, 95% CI 0.86, 0.94); by length of follow-up (<10 years: OR 0.81, 95% CI 0.73, 0.90; >10 years: OR 0.91, 95% CI 0.87, 0.96); by indication for mode of delivery (specified: 0.92, 95% CI 0.88, 0.97; not specified: OR 0.81, 95% CI 0.73, 0.90); by cohort size (<35,000: OR 0.79, 95% CI 0.67, 0.92; >35,000: OR 0.90, 95% CI 0.87, 0.95), by definition of sub-fertility used divided into (birth interval [BI]: OR 0.89, 95% CI 0.84, 0.94; inter-pregnancy interval [IPI]: OR 0.91, 95% CI 0.85, 0.97; and categorical measures: OR 0.81, 95% CI 0.73, 0.90); continuous measures: OR 0.91, 95% CI 0.87, 0.96) were performed. Results of the six studies not included in the meta-analysis (which did not adjust for confounders) are presented individually.
Conclusions: The meta-analysis shows an increased waiting time to next pregnancy and risk of sub-fertility among women with a previous Caesarean delivery. However, included studies are limited by poor epidemiological methods such as variations in the definition of time to next pregnancy, lack of confounding adjustment, or details of the indication for Caesarean delivery. Further research of a more robust methodological quality to better explore any underlying causes of sub-fertility and maternal intent to delay childbearing is warranted.
Figures
Similar articles
-
Maternal and neonatal outcomes of elective induction of labor.Evid Rep Technol Assess (Full Rep). 2009 Mar;(176):1-257. Evid Rep Technol Assess (Full Rep). 2009. PMID: 19408970 Free PMC article.
-
Caesarean delivery and subsequent stillbirth or miscarriage: systematic review and meta-analysis.PLoS One. 2013;8(1):e54588. doi: 10.1371/journal.pone.0054588. Epub 2013 Jan 23. PLoS One. 2013. PMID: 23372739 Free PMC article.
-
Antioxidants for female subfertility.Cochrane Database Syst Rev. 2013 Aug 5;(8):CD007807. doi: 10.1002/14651858.CD007807.pub2. Cochrane Database Syst Rev. 2013. Update in: Cochrane Database Syst Rev. 2017 Jul 28;7:CD007807. doi: 10.1002/14651858.CD007807.pub3. PMID: 23913583 Updated.
-
Impact of Caesarean section on subsequent fertility: a systematic review and meta-analysis.Hum Reprod. 2013 Jul;28(7):1943-52. doi: 10.1093/humrep/det130. Epub 2013 May 3. Hum Reprod. 2013. PMID: 23644593
-
Induction of labour for improving birth outcomes for women at or beyond term.Cochrane Database Syst Rev. 2018 May 9;5(5):CD004945. doi: 10.1002/14651858.CD004945.pub4. Cochrane Database Syst Rev. 2018. Update in: Cochrane Database Syst Rev. 2020 Jul 15;7:CD004945. doi: 10.1002/14651858.CD004945.pub5. PMID: 29741208 Free PMC article. Updated.
Cited by
-
Identifying the factors associated with cesarean section modeled with categorical correlation coefficients in partial least squares.PLoS One. 2019 Jul 26;14(7):e0219427. doi: 10.1371/journal.pone.0219427. eCollection 2019. PLoS One. 2019. PMID: 31348793 Free PMC article.
-
Outcome of subsequent pregnancies in women with complete uterine rupture: A population-based case-control study.Acta Obstet Gynecol Scand. 2022 May;101(5):506-513. doi: 10.1111/aogs.14338. Epub 2022 Mar 2. Acta Obstet Gynecol Scand. 2022. PMID: 35233771 Free PMC article.
-
Comparison between modified Misgav-Ladach and Pfannenstiel-Kerr techniques for Cesarean section: review of literature.J Prenat Med. 2014 Apr-Jun;8(3-4):36-41. J Prenat Med. 2014. PMID: 26265999 Free PMC article. Review.
-
Intra-cavitary fluid resulted from caesarean section but not isthmocele compromised clinical pregnancy after IVF/ICSI treatment.Arch Gynecol Obstet. 2022 Jul;306(1):229-237. doi: 10.1007/s00404-022-06436-0. Epub 2022 Mar 26. Arch Gynecol Obstet. 2022. PMID: 35347382 Free PMC article.
-
The relationship between maternal mental health during pregnancy and type of delivery in the suburbs of Bandar Abbas during 2017-2018.Med J Islam Repub Iran. 2019 Oct 9;33:108. doi: 10.34171/mjiri.33.108. eCollection 2019. Med J Islam Repub Iran. 2019. PMID: 31934568 Free PMC article.
References
-
- ICHSC. The Information Centre for Health and Social Care. England: Maternity Statistics; 2009–10 Publication date: November 18th 2010.
Publication types
MeSH terms
LinkOut - more resources
Full Text Sources
Other Literature Sources
Medical
Molecular Biology Databases
