

Localization of sodium channel subtypes in mouse ventricular myocytes using quantitative immunocytochemistry
- PMID: 23982034
- PMCID: PMC3851329
- DOI: 10.1016/j.yjmcc.2013.08.004
Localization of sodium channel subtypes in mouse ventricular myocytes using quantitative immunocytochemistry
Abstract
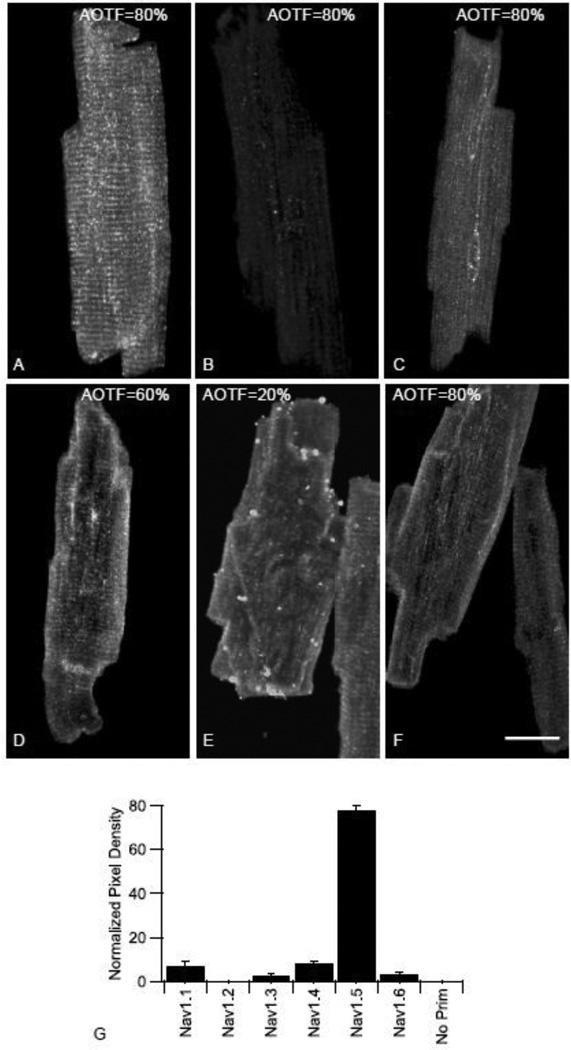
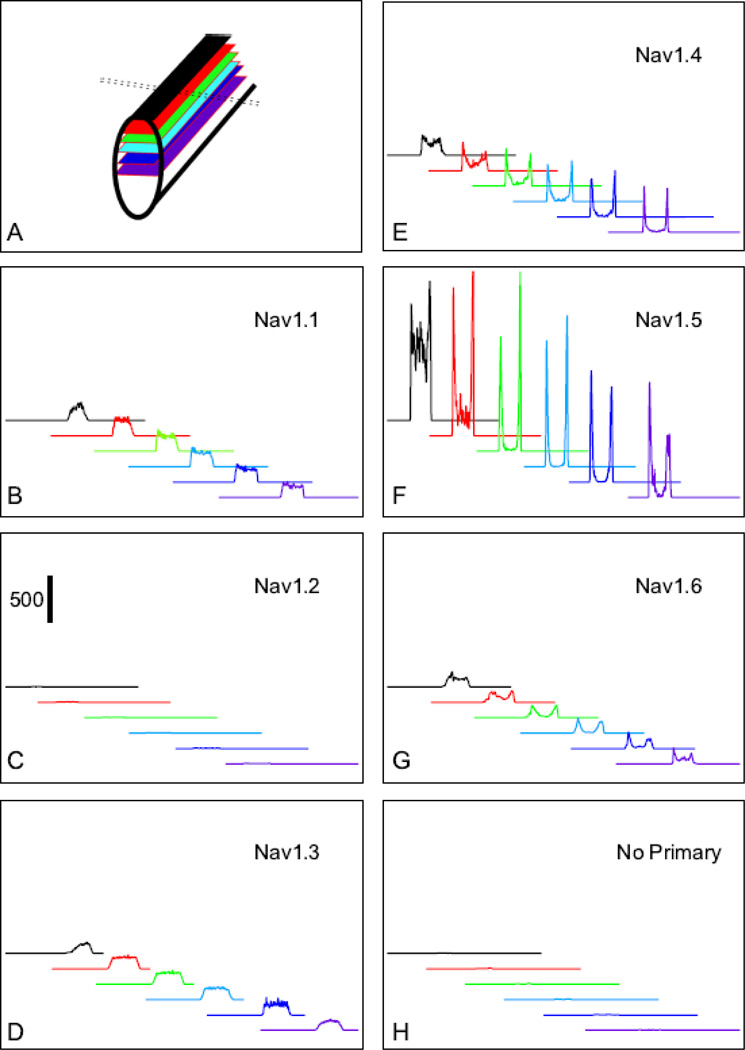
Voltage-gated sodium channels are responsible for the rising phase of the action potential in cardiac muscle. Previously, both TTX-sensitive neuronal sodium channels (NaV1.1, NaV1.2, NaV1.3, NaV1.4 and NaV1.6) and the TTX-resistant cardiac sodium channel (NaV1.5) have been detected in cardiac myocytes, but relative levels of protein expression of the isoforms were not determined. Using a quantitative approach, we analyzed z-series of confocal microscopy images from individual mouse myocytes stained with either anti-NaV1.1, anti-NaV1.2, anti-NaV1.3, anti-NaV1.4, anti-NaV1.5, or anti-NaV1.6 antibodies and calculated the relative intensity of staining for these sodium channel isoforms. Our results indicate that the TTX-sensitive channels represented approximately 23% of the total channels, whereas the TTX-resistant NaV1.5 channel represented 77% of the total channel staining in mouse ventricular myocytes. These ratios are consistent with previous electrophysiological studies in mouse ventricular myocytes. NaV1.5 was located at the cell surface, with high density at the intercalated disc, but was absent from the transverse (t)-tubular system, suggesting that these channels support surface conduction and inter-myocyte transmission. Low-level cell surface staining of NaV1.4 and NaV1.6 channels suggest a minor role in surface excitation and conduction. Conversely, NaV1.1 and NaV1.3 channels are localized to the t-tubules and are likely to support t-tubular transmission of the action potential to the myocyte interior. This quantitative immunocytochemical approach for assessing sodium channel density and localization provides a more precise view of the relative importance and possible roles of these individual sodium channel protein isoforms in mouse ventricular myocytes and may be applicable to other species and cardiac tissue types.
Keywords: Localization; Sodium channels; Ventricular myocytes.
© 2013.
Figures


Similar articles
-
Distribution and function of sodium channel subtypes in human atrial myocardium.J Mol Cell Cardiol. 2013 Aug;61:133-141. doi: 10.1016/j.yjmcc.2013.05.006. Epub 2013 May 20. J Mol Cell Cardiol. 2013. PMID: 23702286 Free PMC article.
-
Density and sub-cellular distribution of cardiac and neuronal sodium channel isoforms in rat ventricular myocytes.Biochem Biophys Res Commun. 2006 Sep 29;348(3):1163-6. doi: 10.1016/j.bbrc.2006.07.189. Epub 2006 Aug 7. Biochem Biophys Res Commun. 2006. PMID: 16904633
-
Functional protein expression of multiple sodium channel alpha- and beta-subunit isoforms in neonatal cardiomyocytes.J Mol Cell Cardiol. 2010 Jan;48(1):261-9. doi: 10.1016/j.yjmcc.2009.04.017. Epub 2009 May 5. J Mol Cell Cardiol. 2010. PMID: 19426735
-
Cell-Adhesion Properties of β-Subunits in the Regulation of Cardiomyocyte Sodium Channels.Biomolecules. 2020 Jul 1;10(7):989. doi: 10.3390/biom10070989. Biomolecules. 2020. PMID: 32630316 Free PMC article. Review.
-
Cardiac sodium channel NaV1.5 distribution in myocytes via interacting proteins: the multiple pool model.Biochim Biophys Acta. 2013 Apr;1833(4):886-94. doi: 10.1016/j.bbamcr.2012.10.026. Epub 2012 Oct 31. Biochim Biophys Acta. 2013. PMID: 23123192 Review.
Cited by
-
A privileged role for neuronal Na+ channels in regulating ventricular [Ca2+] and arrhythmias.J Gen Physiol. 2018 Jul 2;150(7):901-905. doi: 10.1085/jgp.201812120. Epub 2018 Jun 13. J Gen Physiol. 2018. PMID: 29899058 Free PMC article.
-
Cardiac arrhythmia in a mouse model of sodium channel SCN8A epileptic encephalopathy.Proc Natl Acad Sci U S A. 2016 Nov 8;113(45):12838-12843. doi: 10.1073/pnas.1612746113. Epub 2016 Oct 26. Proc Natl Acad Sci U S A. 2016. PMID: 27791149 Free PMC article.
-
The Anti-inflammatory Effects of Short Chain Fatty Acids on Lipopolysaccharide- or Tumor Necrosis Factor α-Stimulated Endothelial Cells via Activation of GPR41/43 and Inhibition of HDACs.Front Pharmacol. 2018 May 23;9:533. doi: 10.3389/fphar.2018.00533. eCollection 2018. Front Pharmacol. 2018. PMID: 29875665 Free PMC article.
-
Scn2a deletion improves survival and brain-heart dynamics in the Kcna1-null mouse model of sudden unexpected death in epilepsy (SUDEP).Hum Mol Genet. 2017 Jun 1;26(11):2091-2103. doi: 10.1093/hmg/ddx104. Hum Mol Genet. 2017. PMID: 28334922 Free PMC article.
-
miR-125 family regulates XIRP1 and FIH in response to myocardial infarction.Physiol Genomics. 2020 Aug 1;52(8):358-368. doi: 10.1152/physiolgenomics.00041.2020. Epub 2020 Jul 27. Physiol Genomics. 2020. PMID: 32716698 Free PMC article.
References
-
- Balser JR. The cardiac sodium channel: Gating function and molecular pharmacology. J Mol Cell Cardiol. 2001;33:599–613. - PubMed
-
- Abriel H. Cardiac sodium channel Nav1.5 and its associated proteins. Arch Mal Coeur Vaiss. 2007;100:787–793. - PubMed
-
- Benndorf K, Boldt W, Nilius B. Sodium current in single myocardial mouse cells. Pflugers Arch. 1985;404:190–196. - PubMed
-
- Cribbs LL, Satin J, Fozzard HA, Rogart RB. Functional expression of the rat heart I Na+ channel isoform. Demonstration of properties characteristic of native cardiac Na+ channels. FEBS Lett. 1990;275:195–200. - PubMed
-
- Chahine M, Deschene I, Chen LQ, Kallen RG. Electrophysiological characteristics of cloned skeletal and cardiac muscle sodium channels. Am J Physiol Heart Circ Physiol. 1996;271:H498–H506. - PubMed
Publication types
MeSH terms
Substances
Grants and funding
LinkOut - more resources
Full Text Sources
Other Literature Sources
