. 2013:4:2370.
doi: 10.1038/ncomms3370.

A comprehensive multiscale framework for simulating optogenetics in the heart

Affiliations

A comprehensive multiscale framework for simulating optogenetics in the heart

Patrick M Boyle et al. Nat Commun. 2013.

Abstract

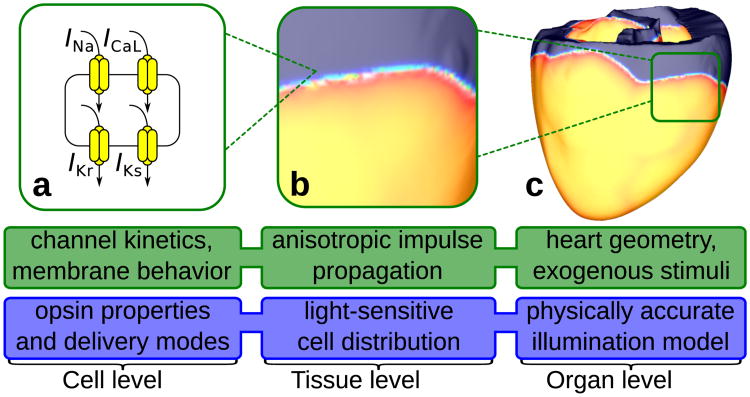
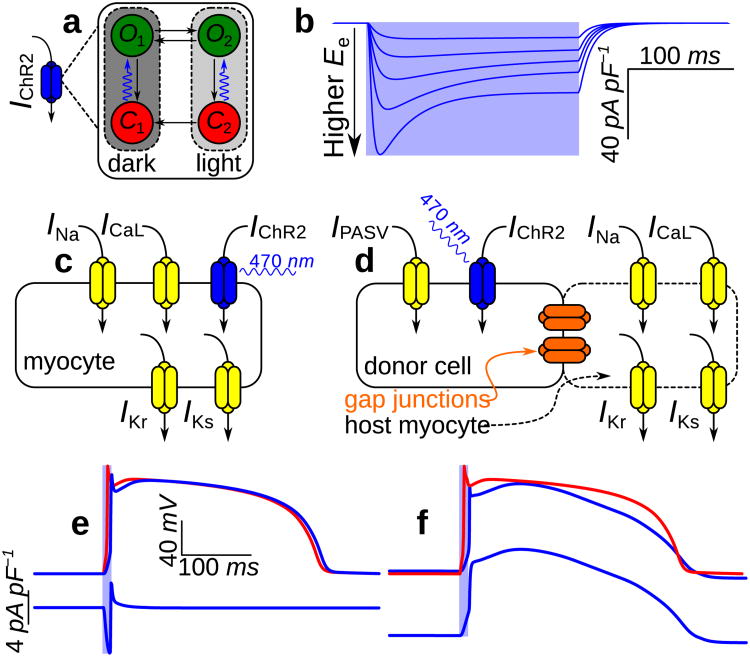
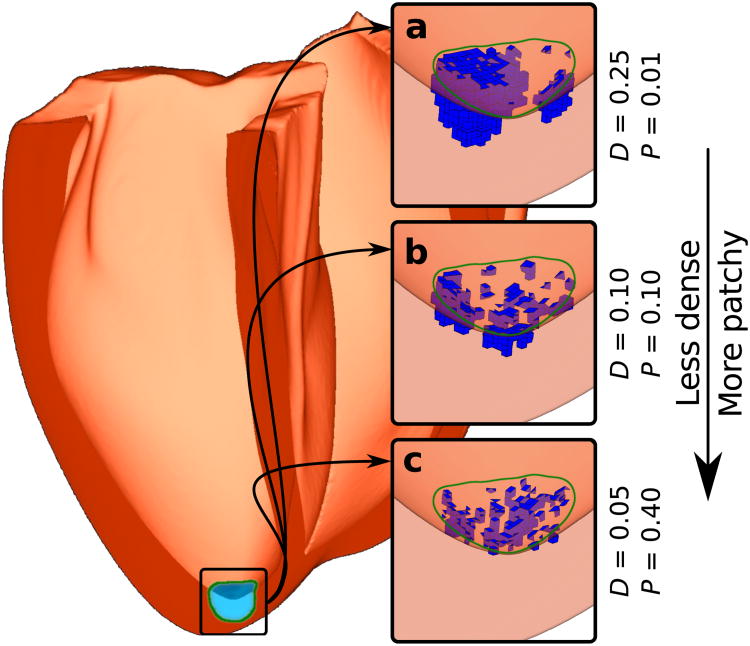
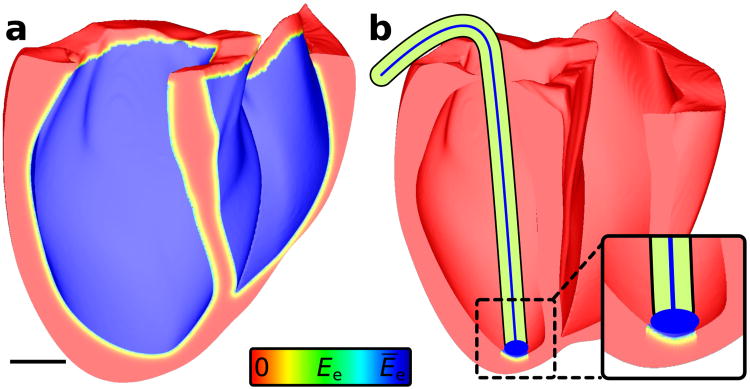
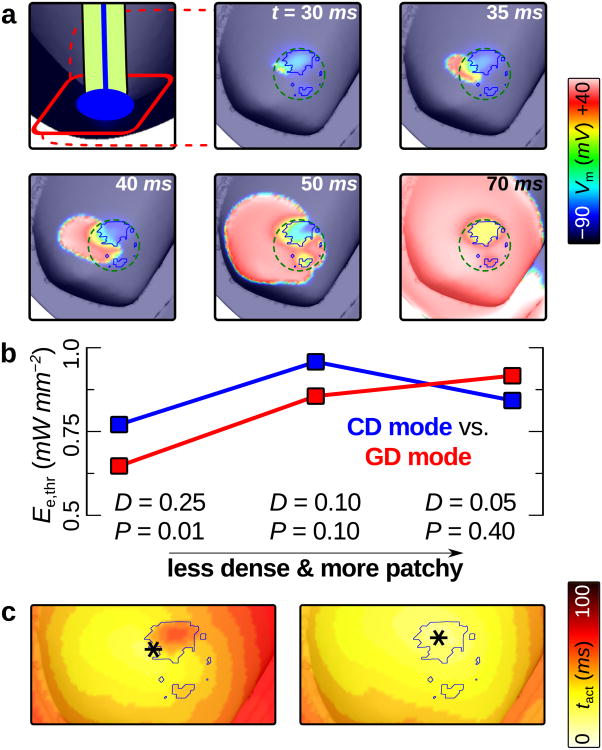
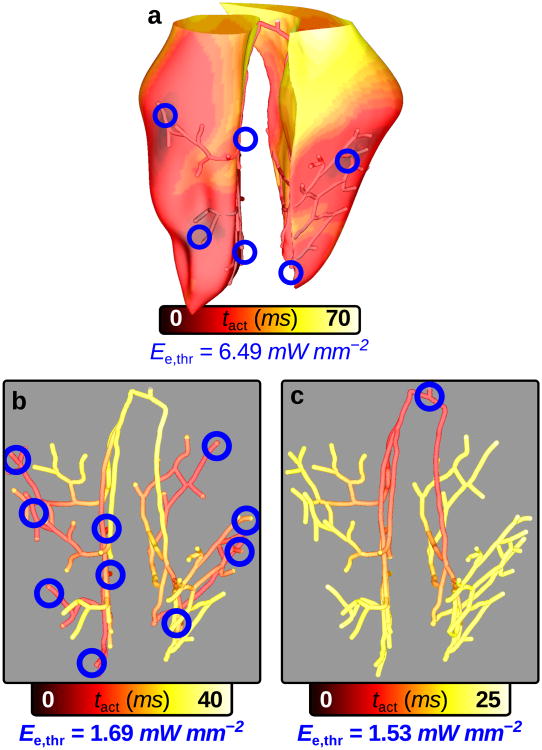
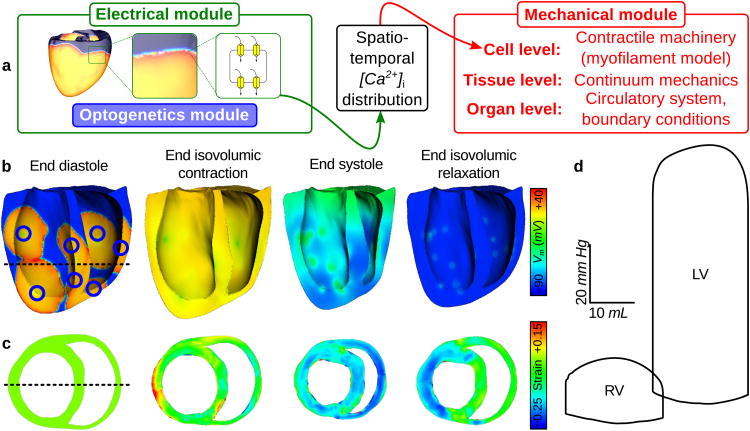
Optogenetics has emerged as an alternative method for electrical control of the heart, where illumination is used to elicit a bioelectric response in tissue modified to express photosensitive proteins (opsins). This technology promises to enable evocation of spatiotemporally precise responses in targeted cells or tissues, thus creating new possibilities for safe and effective therapeutic approaches to ameliorate cardiac function. Here we present a comprehensive framework for multiscale modelling of cardiac optogenetics, allowing both mechanistic examination of optical control and exploration of potential therapeutic applications. The framework incorporates accurate representations of opsin channel kinetics and delivery modes, spatial distribution of photosensitive cells, and tissue illumination constraints, making possible the prediction of emergent behaviour resulting from interactions at sub-organ scales. We apply this framework to explore how optogenetic delivery characteristics determine energy requirements for optical stimulation and to identify cardiac structures that are potential pacemaking targets with low optical excitation thresholds.


Figures

Figure 1
Figure 1. New features for simulating optogenetics
Optogenetics simulation components (blue) are developed at each level of the existing multiscale cardiac model hierarchy (green). (a) Fundamental building blocks of our optogenetic modelling at the cell level include photoevoked current in opsins and opsin delivery modes. We represent opsin currents as complex photokinetic processes that depend nonlinearly on light, membrane voltage, and time. Opsins are either directly delivered to normal myocytes using viral vectors (GD mode) or expressed in inexcitable donor cells (CD mode) which can form gap junctions with host myocytes.(b) At the tissue level, our optogenetic simulation framework incorporates heterogeneous spatial distribution of light-sensitive cells; this is important because diffuse, patchy patterns have been observed for both transgene and donor cell distribution in the heart. (c) At the organ level our framework accounts for practical limitations associated with illumination, namely the limited ability of light to penetrate tissue without significant attenuation due to energy absorption and photon scattering.
Figure 2
Figure 2. Modelling ChR2 properties and delivery modes at the cell level
(a) Four-state Markov model for IChR2 with dark- and light-adapted photocycle branches associated with different peak conductances; each branch comprises closed- (red) and open-channel (green) states. Channel opening rates (blue arrows) are directly proportional to the irradiance (Ee) of light absorbed by ChR2 and open channels approach an Ee-dependent equilibrium between open states O1 and O2; all other transitions are purely time-dependent. (b) IChR2 in response to illumination (pale blue background; top to bottom: Ee = 0.4, 1, 2, 4, and 10mW mm−2) with Vm clamped to —85.6mV. Photoevoked ChR2 current has well-defined transient and steady-state phases resulting from the transition from full dark adaptation to an equilibrium between the two operating modes. The IChR2 model qualitatively reproduces experimental records from whole-cell patch-clamp recordings in a stable HEK-ChR2 cell line, as shown in Supplementary Fig. S1. (c&d) Schematics for modelling gene delivery (GD) and cell delivery (CD) of ChR2; generic ionic currents are shown in myocytes. (e) Optically- (blue) and electrically-evoked (red) action potentials (APs) and underlying IChR2 in a myocyte with gene-delivered ChR2. Illumination at 2× threshold (Ee = 0.468mW mm−2 over 10ms) elicited depolarising IChR2 (bottom), which triggered an optically-evoked AP. (f) Response to illumination in an inexcitable ChR2-rich donor cell (CD; dashed blue) coupled to a normal myocyte by a 500 MΩ resistance (solid blue); a photoevoked AP in the latter cell is compared to an electrically-evoked AP (red). Light delivered to the donor cell was at 2× threshold for optically eliciting an AP in the myocyte (Ee = 0.652mW mm_2 over 10ms). During the AP plateau phase, myocyte Vm (≈ 2.77mV) was between the plateau Vm of the electrically-induced AP (≈ 15.3mV) and the donor cell resting level (−40mV).
Figure 3
Figure 3. Modelling spatial distribution of light-sensitive cells at the tissue level
Human ventricular model with a photosensitisation target (green boundary; hemispherical, 1 cm diameter) near the LV apex. (a-c) Results of applying the light-sensitive cell distribution algorithm to populate the target region with framework-generated ChR2-expressing clusters (blue) for three combinations of the parameters D (density) and P (patchiness).
Figure 4
Figure 4. Modelling light attenuation at the organ level
(a) Spatial profile of effective Ee (normalised to surface irradiance Ēe) in human ventricular model with uniform illumination of the entire endocardium; scale bar: 20 mm. (b) The limited extent of illuminated tissue is emphasised for a more realistic illumination configuration, in which the tip of an optrode — an ensheathed bundle of optical fibres — was pressed against the endocardium and delivered unattenuated light to tissue directly below.
Figure 5
Figure 5. Determinants of optical stimulation efficiency in the human ventricles
(a) Membrane voltage (Vm) response to 10 ms blue light pulse at t = 0. Cell-delivered ChR2 was distributed as in Fig. 3a (D = 0.25, P = 0.01); blue outlines in zoomed-in panels indicate boundaries of ChR2-rich donor cell clusters. Optical stimulation just above threshold (Ee,thr = 0.769 mW mm−2) was applied to the endocardial surface local to the ChR2 delivery site (dashed green line is contour of illuminated area). Supplementary movie 1 shows an animation of the full sequence. (b)Ee,thr values for all optogenetic delivery/distribution configurations. (c) Activation maps for CD mode (top) and GD mode (bottom) ChR2 in the same pattern as (a). *: sites of earliest activation.
Figure 6
Figure 6. Cell-specific optogenetic targeting in rabbit ventricles with Purkinje system
Each response shown here was elicited by applying 1.1×Ee,thr to the endocardial surface under each optrode for 2ms at t = 0. In multi-optrode models (A&B), all 10 delivery sites were illuminated simultaneously to achieve synchronous ventricular depolarisation; Ee,thr was the smallest value that initiated a propagating response when applied to each of the 10 sites independently. (a) Response to illumination of ChR2 delivery sites (blue) in regions of dense Purkinje system (PS) arborisation (see text). Sites were hemispherical (2 mm diameter) with patchy GD of ChR2 in ventricular cells only (D = 0.25, P = 0.1). (b) Response to the same illumination pattern as in (a) but with GD optogenetic targeting of the PS only; Ee,thr was 4.24× lower compared to the model in (a). (c) Response to His bundle illumination for the same model as in (b); Ee,thr was 3.84× lower compared to the model in (a) and optical stimulation was only applied by 1 optrode compared to 10.
Figure 7
Figure 7. Electromechanical response to optical stimulation in canine ventricles
(a) The electrical component (green), which encapsulates optogenetic framework model features (blue), is coupled with the mechanical component (red) by passing 3D intracellular [Ca2+] distribution from the ionic model to a cell-level myofilament model at each time step. (b&c) Long-axis membrane voltage (Vm) and short-axis strain profiles (unitless) during the cardiac cycle. Illumination delivered 12.8 mW mm−2 to 10 ventricular ChR2 delivery sites (blue circles) for 10 ms at t = 0. Delivery sites were hemispherical (3mm diameter) with consolidated CD expression. Dashed line in (b) shows position of slice in (c) and vice-versa. Strain was measured with respect to the end diastolic state. PS fibres were simulated but were not rendered graphically; regions of delayed repolarisation due to long intrinsic PS action potential duration are visible in (b). (d) LV and RV pressure-volume (PV) loops for the photoevoked response. These PV loops matched those for sinus rhythm very closely (cross correlation coefficient γ > 0.9). The 10-site illumination pattern shown here resulted in a more vigorous contraction compared to optical pacing from the endocardial apex only (7.34% increase in stroke volume), due to increased depolarisation synchrony (see Supplementary Fig. S2).

References

    1. Binggeli C, et al. Autonomic nervous system-controlled cardiac pacing: a comparison between intracardiac impedance signal and muscle sympathetic nerve activity. Pacing Clin Electrophysiol. 2000;23:1632–1637. - PubMed
    1. Merrill DR, Bikson M, Jefferys JGR. Electrical stimulation of excitable tissue: design of efficacious and safe protocols. J Neurosci Methods. 2005;141:171–198. - PubMed
    1. Raad D, et al. Implantable electrophysiologic cardiac device infections: a risk factor analysis. Eur J Clin Microbiol Infect Dis. 2012;31:3015–3021. - PubMed
    1. Kutarski A, Pietura R, Czajkowski M. Difficult dual stage transcutaneous lead extraction complicated by fracture of both leads. Cardiol J. 2012;19:412–417. - PubMed
    1. Brenyo A, Goldenberg I, Barsheshet A. The downside of right ventricular apical pacing. Indian Pacing Electrophysiol J. 2012;12:102–113. - PMC - PubMed

Publication types

Substances

LinkOut - more resources