

Triple negative breast cancer initiating cell subsets differ in functional and molecular characteristics and in γ-secretase inhibitor drug responses
- PMID: 23982961
- PMCID: PMC3799576
- DOI: 10.1002/emmm.201302558
Triple negative breast cancer initiating cell subsets differ in functional and molecular characteristics and in γ-secretase inhibitor drug responses
Abstract
Increasing evidence suggests that stem-like cells mediate cancer therapy resistance and metastasis. Breast tumour-initiating stem cells (T-ISC) are known to be enriched in CD44(+) CD24(neg/low) cells. Here, we identify two T-ISC subsets within this population in triple negative breast cancer (TNBC) lines and dissociated primary breast cancer cultures: CD44(+) CD24(low+) subpopulation generates CD44(+) CD24(neg) progeny with reduced sphere formation and tumourigenicity. CD44(+) CD24(low+) populations contain subsets of ALDH1(+) and ESA(+) cells, yield more frequent spheres and/or T-ISC in limiting dilution assays, preferentially express metastatic gene signatures and show greater motility, invasion and, in the MDA-MB-231 model, metastatic potential. CD44(+) CD24(low+) but not CD44(+) CD24(neg) express activated Notch1 intracellular domain (N1-ICD) and Notch target genes. We show N1-ICD transactivates SOX2 to increase sphere formation, ALDH1+ and CD44(+) CD24(low+) cells. Gamma secretase inhibitors (GSI) reduced sphere formation and xenograft growth from CD44(+) CD24(low+) cells, but CD44(+) CD24(neg) were resistant. While GSI hold promise for targeting T-ISC, stem cell heterogeneity as observed herein, could limit GSI efficacy. These data suggest a breast T-ISC hierarchy in which distinct pathways drive developmentally related subpopulations with different anti-cancer drug responsiveness.
Keywords: GSI; Notch1; Sox2; breast cancer stem cells; metastasis.
© 2013 The Authors. Published by John Wiley and Sons, Ltd on behalf of EMBO.
Figures
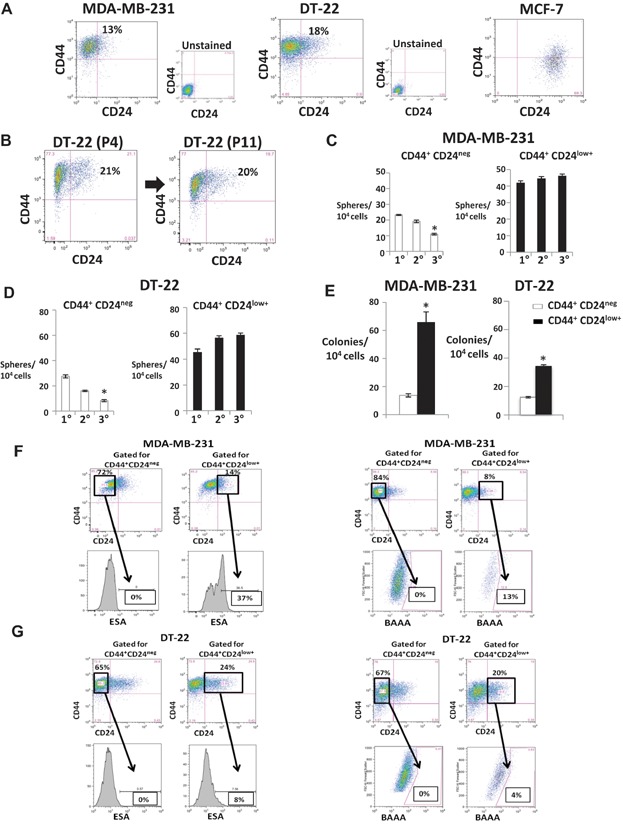
A. CD44 and CD24 in MDA-MB-231, DT-22 and MCF7. Unstained controls are shown.
B. Surface expression of CD44 and CD24 in DT-22 at passage four (P4) was similar to that at passage 11 (P11).
C,D. Mean ± SEM serial mammospheres formed/104 cells seeded from sorted CD44+CD24low+ and CD44+CD24neg from MDA-MB-231 (*p = 0.0003) (C) and DT-22 (*p = 0.0001 Student's t-test) (D).
E. Mean ± SEM soft agar colonies from MDA-MB-231 (*p = 0.00024) and DT-22 (*p = 0.0016).
F,G. ESA+ and ALDH1+ are detected in a minority of CD44+CD24low+ but not in CD44+CD24neg populations. CD24 and CD44 were assayed together with either ESA or Aldefluor assays as described. Cells gated CD44+CD24neg and CD44+CD24low+ from MDA-MB-231 (F) and DT-22 (G) were assayed for percentage of surface ESA (left) and percentage of ALDH1+ cells (right).
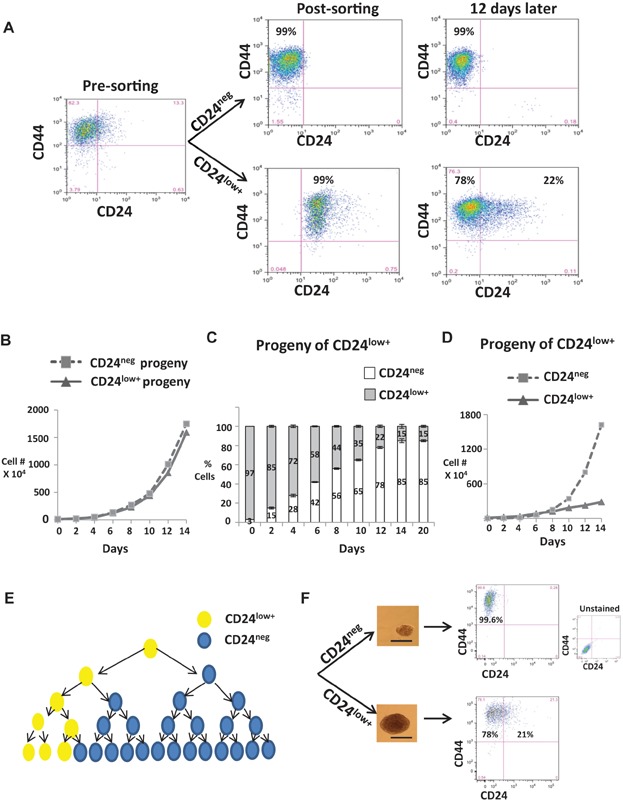
CD44 and CD24 analysis before and 12 days after sorting.
Population growth from sorted CD44+CD24low+ and CD44+CD24neg.
Proportions of CD44+CD24low+ or CD44+CD24neg cells arising from CD44+CD24low+ cells.
Growth curves of progeny arising from CD44+CD24low+ over time. Findings validated in DT-22 and DT-25, see in Supporting Information Fig S3.
Model depicting largely asymmetric division of CD44+CD24low+ cells generating mostly CD44+CD24neg progeny with a modest increase in CD44+CD24low+ over time.
CD44 and CD24 analysis of dissociated spheres initiated by single isolated CD44+CD24low+ or CD44+CD24neg cells. Scale bar = 75 µm.
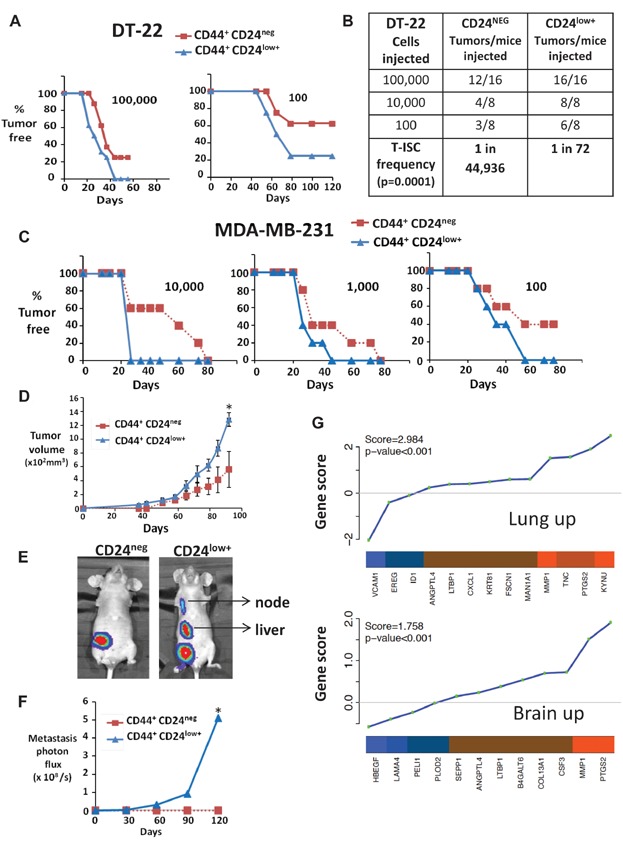
Tumour formation from indicated numbers of sorted CD44+CD24neg (red) or CD44+CD24low+ (blue) DT22 cells is graphed over time.
Calculated T-ISC frequency from limiting dilution assays with DT22 CD44+CD24neg and CD44+CD24low+.
Tumours from 10,000, 1000 and 100 sorted CD44+CD24neg (red) or CD44+CD24low+ (blue) MDA-MB-231 cells.
Mean MDA-MB-231 xenograft volume from 10,000 injected CD44+CD24neg (red) or CD44+CD24 (blue) cells (means graphed ± SEM, *p = 0.019, comparative analysis of growth curves).
Primary tumours (1 cm diameter) were excised and metastasis monitored by IVIS. Representative IVIS images are shown.
Bioluminescence (photons × 108/s) of metastatic tumour burden from CD44+CD24low+ tumours and CD44+CD24neg is graphed (mean graphed ± SEM, *p = 0.001, comparative analysis of growth curves).
Gene set analysis (GSA) shows preferential expression of lung and brain metastasis signatures in CD44+CD24low+ versus CD44+CD24neg. Shown are ordered gene scores for each gene in the line plot and the average fold change in the heatmap (orange = high expression in CD44+CD24low+ and blue = low); enrichment score and p-value shown in upper left (see also bone mets signature and similar GSA for sorted DT-22 in Supporting Information Fig S4).
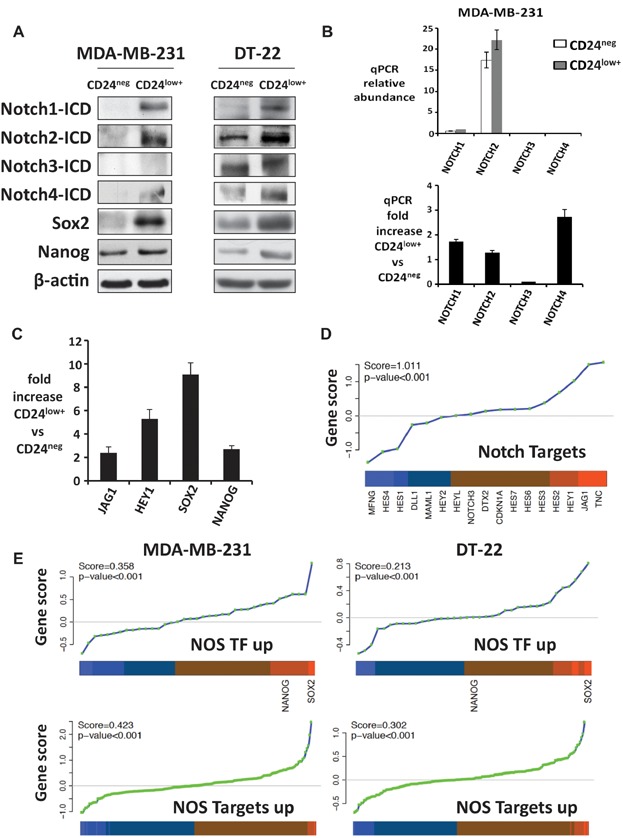
Western blots.
Relative abundance of Notch 1, 2, 3 and 4 (top) expression by qPCR and mean fold increase in CD24low+ versus CD24neg ± SEM (bottom) are shown for MDA-MB-231.
Notch target gene expression is enriched in MDA-MB-231 CD44+CD24low+ cells.
GSA shows CD44+CD24low+ preferentially express Notch target genes defined by GSI washout.
GSA shows CD44+CD24low+ preferentially express NOS-targets and NOS-TFs. The ordered scores for each gene in the line plot and the average fold change in the heatmap are shown (orange indicates high in CD44+CD24low+ and blue, low) with enrichment scores and p values (see similar GSA for ES-TFs for both lines and NOS-targets, and NOS-TFs in sorted DT-22 in Supporting Information Fig S5).
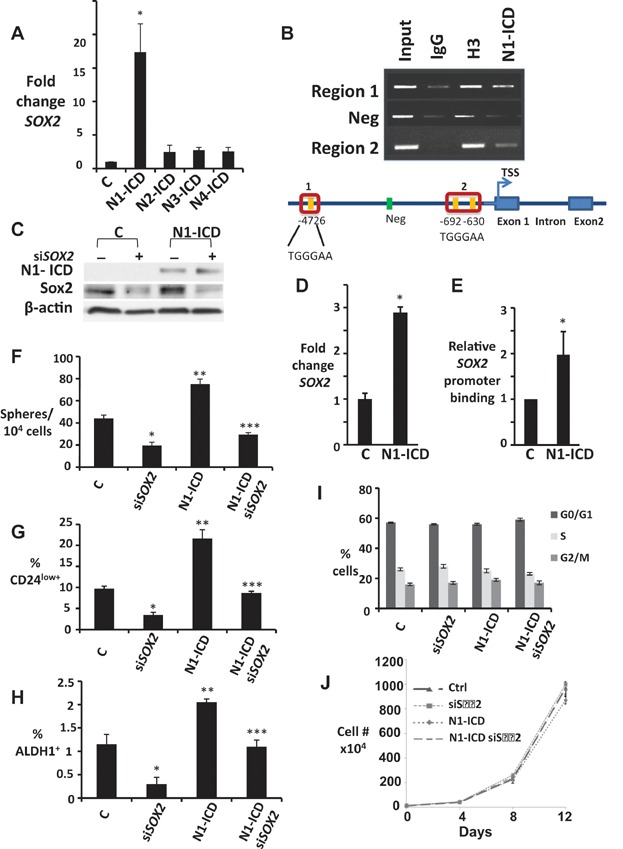
A. SOX2 qPCR in HC-11 cells ± N1-ICD, N2-ICD, N3-ICD or N4-ICD overexpression, graphed as fold change versus parental controls, normalized to HPRT. *p = 0.018.
B. ChIP shows N1-ICD and control histone H3 binding to indicated CSL binding sites in murine SOX2 promoter in HC-11 (top). Schematic of murine SOX2 promoter (bottom).
C–E. Controls or N1-ICD overexpressing MDA-MB-231 cells were assayed for N1-ICD and Sox2 by Western (C) SOX2 expression by qPCR (*p = 0.006) (D) and relative binding of N1-ICD to SOX2 promoter (E) and means graphed ± SEM.
F–H. Effects of siSOX2 were assayed in MDA-MB-231 ± N1-ICD overexpression on spheres formed/10,000 plated cells (F), % of CD44+CD24low+ (G) and % ALDH1+ cells (H). Graphs show mean ± SEM; For (F), ***p = 0.019, **p = 0.032 and *p = 0.026; for (G), ***p = 0.0049, **p = 0.0048 and *p = 0.0007 and for (H), ***p = 0.04, **p = 0.03 and *p = 0.01 (Student's t-test compared to control, C).
I. Cell cycle profiles of siSOX2 in MDA-MB-231 ± N1-ICD overexpression.
J. Proliferation curves are unchanged by siSOX2 in MDA-MB-231 cells ± N1-ICD overexpression.
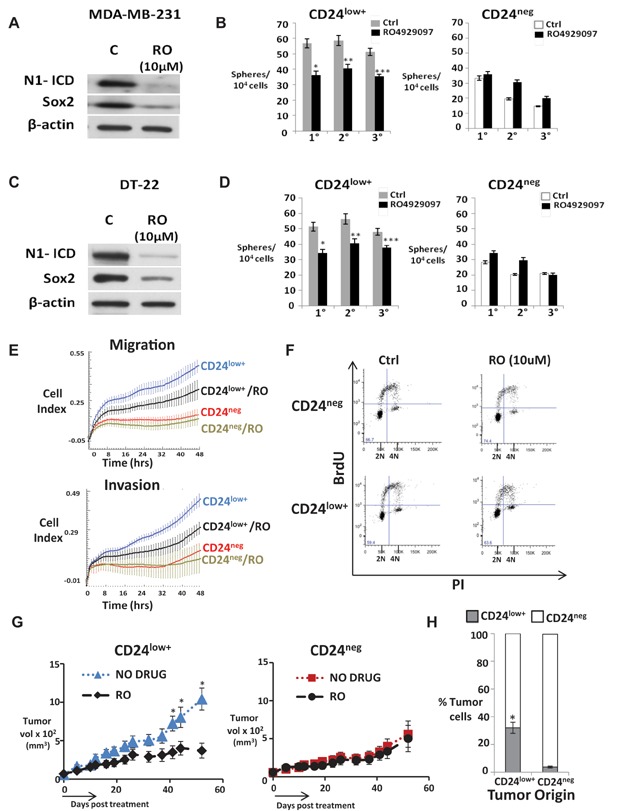
A,C. Cleaved Notch1 and Sox2 levels before (C) and after 24 h of 10 µM RO4929097 in CD24low+ cells.
B,D. Serial mammospheres from indicated sorted cell populations ±10 µM RO4929097 (mean ± SEM, Student's t-test). The p values in panel B: *p = 0.00002; **p = 0.0018; ***p = 0.004; panel D: *p = 0.00004; **p = 0.003; ***p = 0.0015. The GSI, DAPT, showed similar effects on sorted MDA-MB-231, DT-22 and DT-25 see Supporting Information Fig S6A–F.
E. Migration and matrigel invasion of sorted populations from MDA-MB-231 ± 10 µM RO4929097 (RO) generated by xCELLigence real time cell analysis, graphed as mean ± SD. CD24low+ cells show significantly greater migration and invasion compared to CD24neg cells (p = 0.0003 at T = 48 h). RO significantly inhibited migration (p = 0.0002 at T = 48hrs) and invasion (p = 0.0002 at T = 48 h) of CD24low+ cells. CD24neg cells were unaffected (see also data for DT-22 in Supporting Information Fig S6G).
F. Cell cycle profiles of sorted DT-22 populations after 48 h ±10 µM RO were unchanged. Cell cycle profiles and proliferation curves of sorted populations were similar with and without RO treatment in MDA-MB-231 and DT-22 (see Supporting Information Fig S6H–J).
G. Volume of DT-22 xenografts arising from CD24low+ or CD24neg ±14-day RO4929097 treatment as described, graphed as mean ± SEM, Student's t-test. *p = 0.005 (Day 40); *p = 0.008 (Day 48); *p = 0.004 (Day 55).
H. Tumours arising from sorted CD24low+ or CD24neg DT-22 cells (n = 18 each group) were excised at mean 1.2 cm, dissociated into single cell suspensions and stained for surface CD44 and CD24 expression. All cells were CD44+. Mean CD24 expression in each tumour group is shown as a mean % of total ± SEM (*p = 0.0003, Student's t-test).
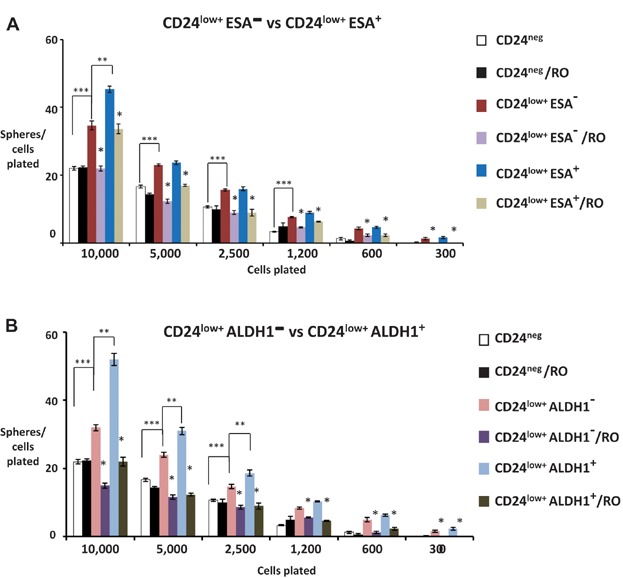
MDA-MB-231 cells were flow sorted into either CD44+CD24neg, CD44+ CD24low+ ESA− and CD44+CD24low+ ESA+ subpopulations and analysed for frequency of sphere forming cells by limiting dilution assay ±10 µM RO4929097 (RO). Mean of spheres/cells plated are plotted from triplicate data from each of two independent experiments. The p values for 10,000 cells: ***p = 0.01; **p = 0.03; *p = 0.01 and 0.03; for 5000 cells: *p = 0.001 and 0.007; for 2500 cells: *p = 0.001 and 0.007; for 1250 cells: *p = 0.003 and 0.006; for 600 cells: *p = 0.001 and 0.007; for 300 cells: *p = 0.02 and 0.007 (Student's t-test).
MDA-MB-231 cells were flow sorted into either CD44+CD24neg, CD44+CD24low+ALDH1− and CD44+CD24low+ALDH1+ subpopulations and analysed for frequency of sphere forming cells by limiting dilution assay ±10 µM RO. Mean spheres/cells plated are plotted from triplicate data from each of two independent experiments. The p values for 10,000 cells: ***p = 0.01; **p = 0.01; *p = 0.001 and 0.01; for 5000 cells: ***p = 0.01; **p = 0.05; *p = 0.008 and 0.001; for 2500 cells: ***p = 0.01; **p = 0.02; *p = 0.001 and 0.003; for 1250 cells: *p = 0.047 and 0.00045; for 600 cells: *p = 0.005 and 0.00045; for 300 cells: *p = 0.007 and 0.0002 (Student's t-test). Cells used in (A) and (B) above were sorted simultaneously.
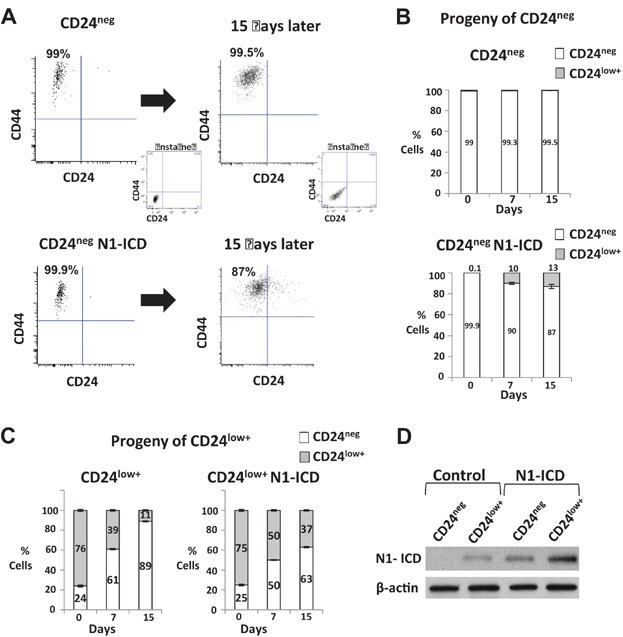
A–D. N1-ICD was expressed MDA-MB-231 and N1-ICD-CD44+CD24neg (A,B,D) and N1-ICD-CD44+CD24low+ (C,D) populations were sorted and compared with their counterparts in vector control MDA-MB-231 cells. Progeny of each were counted, and the proportion of cells expressing CD24 analysed by flow cytometry over a period of 15 days is graphed as mean ± SEM. Note that cell number increase over time was similar with and without N1-ICD expression (Fig 5J). NI-ICD expression is shown by western blot in controls and in N1-ICD-CD44+CD24neg and N1-ICD-CD44+CD24low+ (D).
References
-
- Aigner S, Ramos CL, Hafezi-Moghadam A, Lawrence MB, Friederichs J, Altevogt P, Ley K. CD24 mediates rolling of breast carcinoma cells on P-selectin. FASEB J. 1998;12:1241–1251. - PubMed
-
- Athanassiadou P, Grapsa D, Gonidi M, Athanassiadou AM, Tsipis A, Patsouris E. CD24 expression has a prognostic impact in breast carcinoma. Pathol Res Pract. 2009;205:524–533. - PubMed
-
- Bayliss J, Hilger A, Vishnu P, Diehl K, El-Ashry D. Reversal of the estrogen receptor negative phenotype in breast cancer and restoration of antiestrogen response. Clin Cancer Res. 2007;13:7029–7036. - PubMed
Publication types
MeSH terms
Substances
Grants and funding
LinkOut - more resources
Full Text Sources
Other Literature Sources
Molecular Biology Databases
Miscellaneous
