

Bayesian hierarchical modeling of patient subpopulations: efficient designs of Phase II oncology clinical trials
- PMID: 23983156
- PMCID: PMC4319656
- DOI: 10.1177/1740774513497539
Bayesian hierarchical modeling of patient subpopulations: efficient designs of Phase II oncology clinical trials
Abstract
Background: In oncology, the treatment paradigm is shifting toward personalized medicine, where the goal is to match patients to the treatments most likely to deliver benefit. Treatment effects in various subpopulations may provide some information about treatment effects in other subpopulations.
Purpose: We compare different approaches to Phase II trial design where a new treatment is being investigated in several groups of patients. We compare considering each group in an independent trial to a single trial with hierarchical modeling of the patient groups.
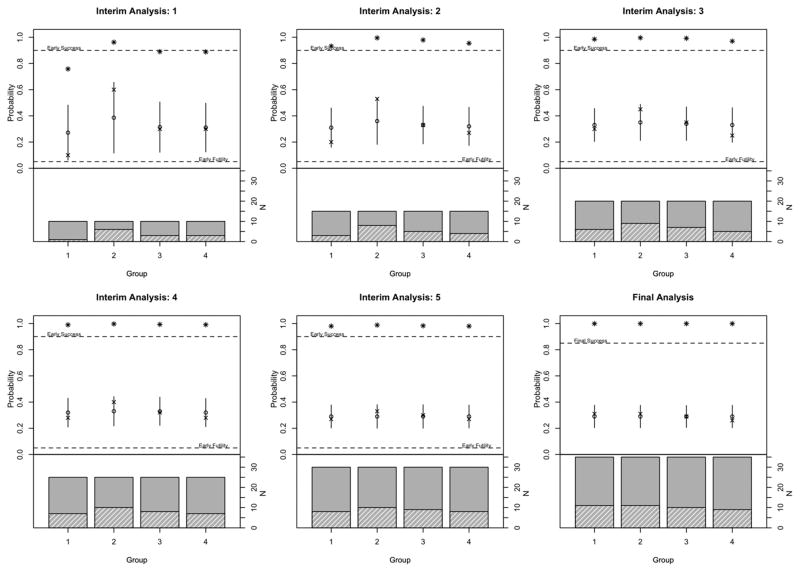
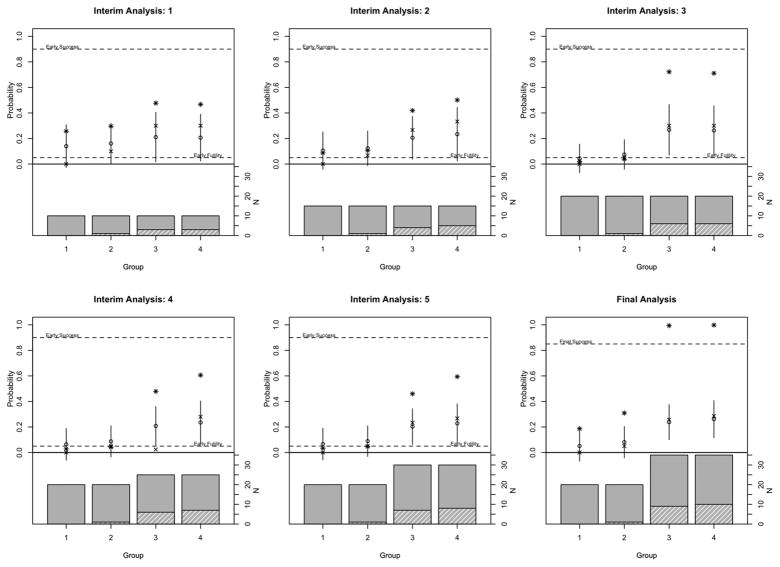
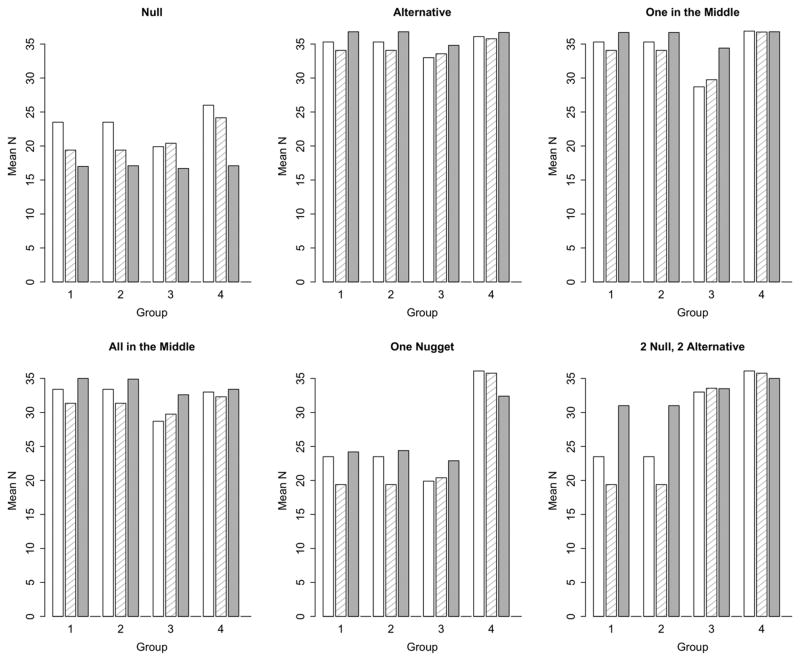
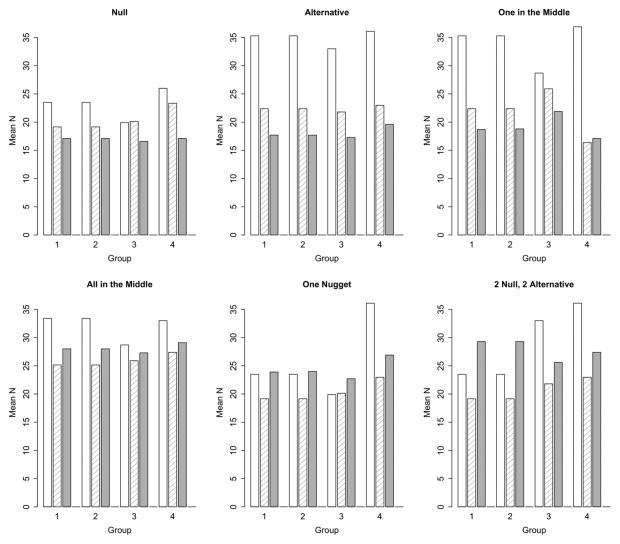
Methods: We assume four patient groups with different background response rates and simulate operating characteristics of three trial designs, Simon's Optimal Two-Stage design, a Bayesian adaptive design with frequent interim analyses, and a Bayesian adaptive design with frequent interim analyses and hierarchical modeling across patient groups.
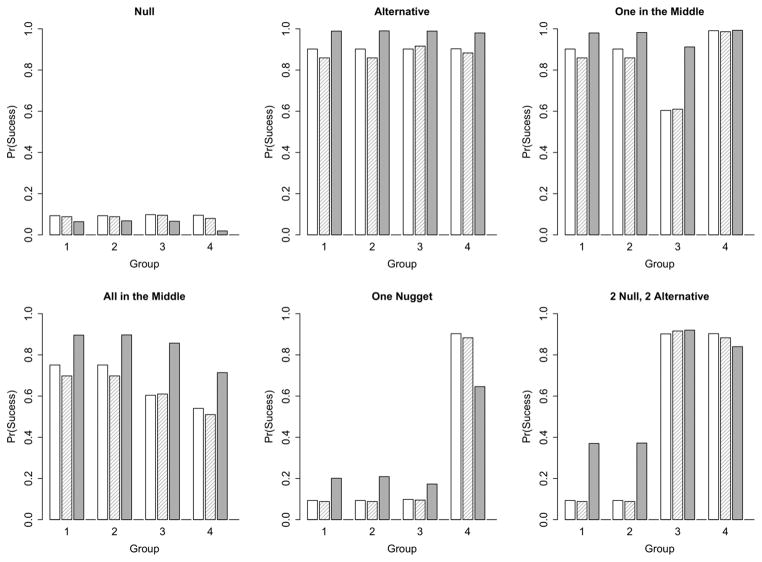
Results: Simon's designs are based on 10% Type I and Type II error rates. The independent Bayesian designs are tuned to have similar error rates, but may have a slightly smaller mean sample size due to more frequent interim analyses. Under the null, the mean sample size is 2-4 patients smaller. A hierarchical model across patient groups can provide additional power and a further reduction in mean sample size. Under the null, the addition of the hierarchical model decreases the mean sample size an additional 4-7 patients in each group. Under the alternative hypothesis, power is increased to at least 98% in all groups.
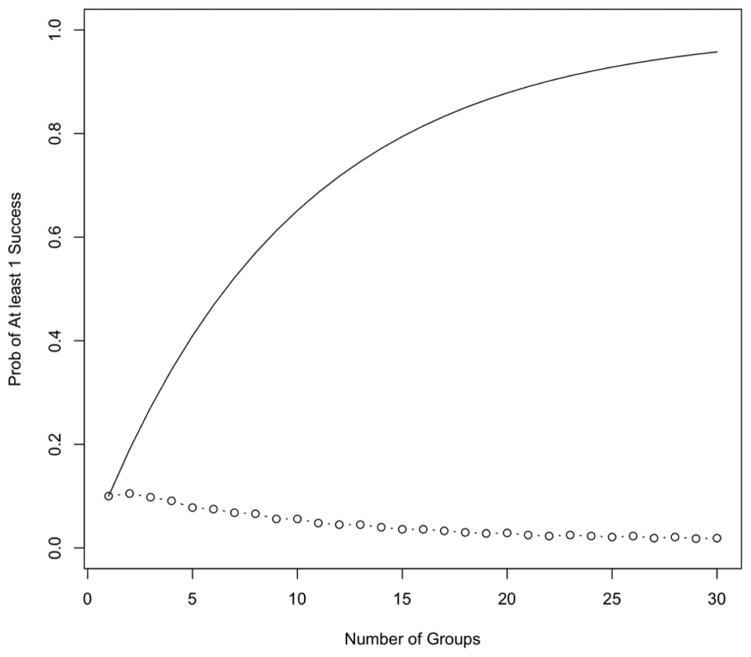
Limitations: Hierarchical borrowing can make finding a single group in which the treatment is promising, if there is only one, more difficult. In a scenario where the treatment is uninteresting in all but one group, power for that one group is reduced to 65%. When the drug appears promising in some groups and not in others, there is potential for borrowing to inflate the Type I error rate.
Conclusions: The Bayesian hierarchical design is more likely to correctly conclude efficacy or futility than the other two designs in many scenarios. The Bayesian hierarchical design is a strong design for addressing possibly differential effects in different groups.
Conflict of interest statement
Scott Berry and Donald Berry are co-owners of Berry Consultants, LLC, a company that specializes in designing Bayesian adaptive trials for pharmaceutical and medical device companies and NIH cooperative groups. Kristine Broglio is an employee of Berry Consultants.
Figures
References
-
- Hamburg MA, Collins FS. The path to personalized medicine. N Engl J Med. 2010;363(4):301–04. - PubMed
-
- Berry SM, Carlin BP, Lee JJ, Muller P. Bayesian Adaptive Methods for Clinical Trials. CRC Press; Boca Raton, FL: 2011.
-
- Berry DA. Bayesian clinical trials. Nat Rev Drug Discov. 2006;5(1):27–36. - PubMed
-
- Stein C. Inadmissibility of the usual estimator for the mean of a multivariate normal distribution. Proc Third Berkeley Symp Math Stat Probab. 1956;1:197–206.
Publication types
MeSH terms
Grants and funding
LinkOut - more resources
Full Text Sources
Other Literature Sources
