. 2013 Aug 28:14:579.
doi: 10.1186/1471-2164-14-579.

Molecular footprints of domestication and improvement in soybean revealed by whole genome re-sequencing

Affiliations

Molecular footprints of domestication and improvement in soybean revealed by whole genome re-sequencing

Ying-hui Li et al. BMC Genomics. .

Abstract

Background: Artificial selection played an important role in the origin of modern Glycine max cultivars from the wild soybean Glycine soja. To elucidate the consequences of artificial selection accompanying the domestication and modern improvement of soybean, 25 new and 30 published whole-genome re-sequencing accessions, which represent wild, domesticated landrace, and Chinese elite soybean populations were analyzed.

Results: A total of 5,102,244 single nucleotide polymorphisms (SNPs) and 707,969 insertion/deletions were identified. Among the SNPs detected, 25.5% were not described previously. We found that artificial selection during domestication led to more pronounced reduction in the genetic diversity of soybean than the switch from landraces to elite cultivars. Only a small proportion (2.99%) of the whole genomic regions appear to be affected by artificial selection for preferred agricultural traits. The selection regions were not distributed randomly or uniformly throughout the genome. Instead, clusters of selection hotspots in certain genomic regions were observed. Moreover, a set of candidate genes (4.38% of the total annotated genes) significantly affected by selection underlying soybean domestication and genetic improvement were identified.

Conclusions: Given the uniqueness of the soybean germplasm sequenced, this study drew a clear picture of human-mediated evolution of the soybean genomes. The genomic resources and information provided by this study would also facilitate the discovery of genes/loci underlying agronomically important traits.


Figures
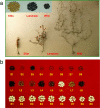
Figure 1
Figure 1
The photo of 25 re-sequenced soybean accessions. The photo of (a) typical wild, landrace and elite soybean plant and (b) seed of 25 re-sequenced soybean accessions.
Figure 2
Figure 2
Phylogenetic tree and population structure of 25 re-sequenced soybean accessions. a, Neighbor-joining tree of soybean accessions. Northeast region. South region. Middle part of Huanghuai region. North part of Huanghuai region. South part of Huanghuai region. W82, Williams 82. b, Population structure inferred by ADMIXTURE. Each accession shown as a vertical line partitioned into K colored components represents inferred membership in K genetic clusters. Blue, wild lines; red, landrace lines; green, elite cultivars.
Figure 3
Figure 3
Overlap of (a) total SNPs, (b) SNPs in CDS region, and (c) non-synonymous SNPs in three soybean gene pools (wild, landrace and elite cultivar).
Figure 4
Figure 4
Detection of candidate genome region and genes underwent selection during domestication and genetic improvement. The distribution of domestication (a) and genetic improvement (c) regions and genes on the soybean chromosomes. Rectangular bar, number of regions; line, number of genes. Polymorphism distribution between cultivated (landrace plus elite) and wild populations (b), as well as between elite and wild groups (d) in candidate region (green line) versus the whole genome (red line).
Figure 5
Figure 5
Accumulation of domestication and improvement genes in different pathways of KEGG (χ2 test, P< 0.05). CW: domestication genes; EL: improvement genes; GNM: genome wide genes.
Figure 6
Figure 6
The gene diversity of genomic regions of seed size (a) and seed coat blooming (b) on chromosome 13. Top, Tajima’s D (green line); LE PBS (gray shading). Genomic diversity of wild group (red dotted line) and cultivated group (blue dotted line) displayed by π (pi) are plotted using 500 kbp sliding windows. The square frames along the chromosome indicate regions selected during domestication (green) and genetic improvement (purple).

References

    1. Hymowitz T. In: Soybeans: Improvement, Production and Uses. 3. Boerma HR, Specht JE, editor. Wisconsin, USA: Madison; 2004. Speciation and cytogenetics; pp. 97–129.
    1. Singh RJ, Hymowitz T. Soybean genetic resources and crop improvement. Genome. 1999;42:605–616. doi: 10.1139/g99-039. - DOI
    1. Doebley JF, Gaut BS, Smith BD. The molecular genetics of crop domestication. Cell. 2006;127(7):1309–1321. doi: 10.1016/j.cell.2006.12.006. - DOI - PubMed
    1. Purugganan M. The molecular population genetics of regulatory genes. Mol Ecol. 2000;9(10):1451–1461. doi: 10.1046/j.1365-294x.2000.01016.x. - DOI - PubMed
    1. Tanksley SD, McCouch SR. Seed banks and molecular maps: unlocking genetic potential from the wild. Science. 1997;277(5329):1063–1066. doi: 10.1126/science.277.5329.1063. - DOI - PubMed

Publication types