. 2013 Aug 28:14:583.
doi: 10.1186/1471-2164-14-583.

Genome-wide gene expression profiling of stress response in a spinal cord clip compression injury model

Affiliations

Genome-wide gene expression profiling of stress response in a spinal cord clip compression injury model

Mahmood Chamankhah et al. BMC Genomics. .

Abstract

Background: The aneurysm clip impact-compression model of spinal cord injury (SCI) is a standard injury model in animals that closely mimics the primary mechanism of most human injuries: acute impact and persisting compression. Its histo-pathological and behavioural outcomes are extensively similar to human SCI. To understand the distinct molecular events underlying this injury model we analyzed global mRNA abundance changes during the acute, subacute and chronic stages of a moderate to severe injury to the rat spinal cord.

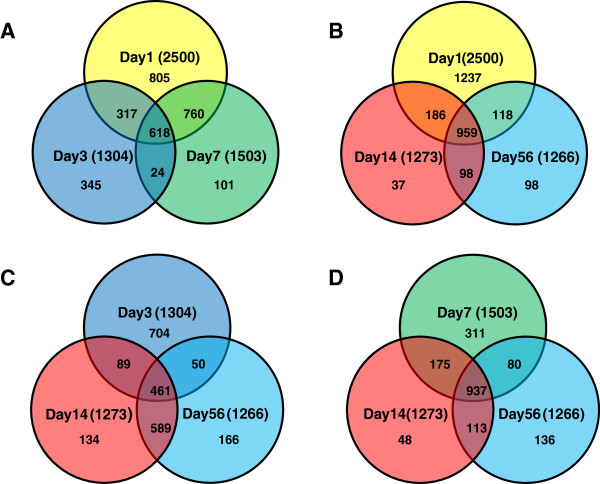
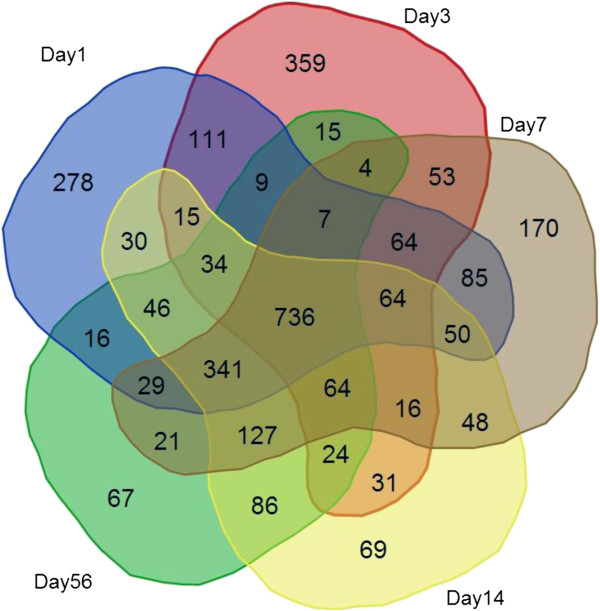
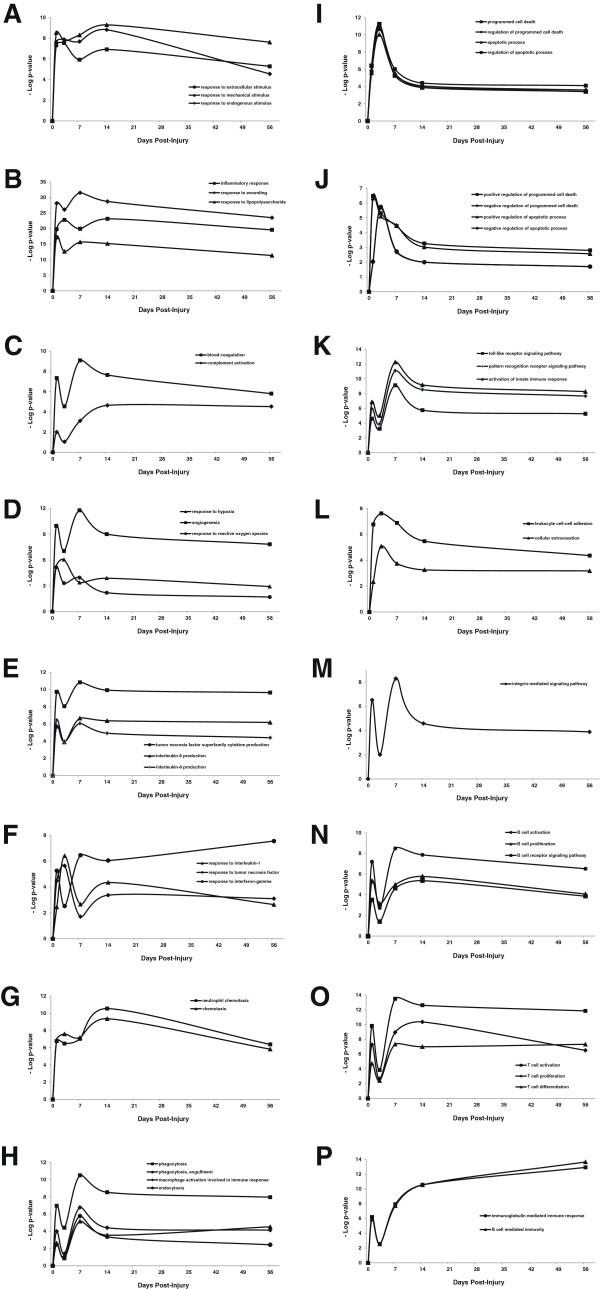
Results: Time-series expression analyses resulted in clustering of the majority of deregulated transcripts into eight statistically significant expression profiles. Systematic application of Gene Ontology (GO) enrichment pathway analysis allowed inference of biological processes participating in SCI pathology. Temporal analysis identified events specific to and common between acute, subacute and chronic time-points. Processes common to all phases of injury include blood coagulation, cellular extravasation, leukocyte cell-cell adhesion, the integrin-mediated signaling pathway, cytokine production and secretion, neutrophil chemotaxis, phagocytosis, response to hypoxia and reactive oxygen species, angiogenesis, apoptosis, inflammatory processes and ossification. Importantly, various elements of adaptive and induced innate immune responses span, not only the acute and subacute phases, but also persist throughout the chronic phase of SCI. Induced innate responses, such as Toll-like receptor signaling, are more active during the acute phase but persist throughout the chronic phase. However, adaptive immune response processes such as B and T cell activation, proliferation, and migration, T cell differentiation, B and T cell receptor-mediated signaling, and B cell- and immunoglobulin-mediated immune response become more significant during the chronic phase.

Conclusions: This analysis showed that, surprisingly, the diverse series of molecular events that occur in the acute and subacute stages persist into the chronic stage of SCI. The strong agreement between our results and previous findings suggest that our analytical approach will be useful in revealing other biological processes and genes contributing to SCI pathology.


Figures

Figure 1
Figure 1
Time - Point ProbeSet Data Analysis. A. Unsupervised machine learning grouping of animals by expression. To visualize temporal patterns as well as inter-animal variability, unsupervised machine learning was employed followed by a divisive hierarchical clustering algorithm (DIANA) to cluster differentially expressed ProbeSets in any pair-wise contrast (see Methods). Finally, standard agglomerative hierarchical clustering was used to group animals. The result is visualized using the Heatplus package of BioConductor. Heatmap (columns: samples; rows: genes, in red and blue coloring, depicting up- and down-regulation respectively). B. Principal Component Analysis of Individual Time Point Transcripts. Using Partek GS version 6.5, we performed principal component analysis (PCA) of the 33042 transcripts on the 230 2.0 GeneChip array for all animals at each time point to assess variability of the data across individual animals and time points. There are inter-individual differences but eclipses show that there are no outliers in our experiment. Additionally, the eclipses of Day 7, 14 and 56 cross each other, which indicate some level of commonality between these time points, as was evidenced and shown in the tree view of the heat map. C. Volcano plots of fold change values of all 33042 ProbeSets vs. transformed (− log10) ANOVA t test p-values. Individual time point data were plotted for comparison. ANOVA t test p-values for pair-wise contrasts between each time point data relative to sham were calculated and transformed to - log10 values and plotted against fold change values. D. Percentage of ProbeSets with ANOVA t test p-values higher than 0.05. The percentage of ProbeSets with p-values higher than 0.05 was calculated at all time-points and plotted at various fold change values.
Figure 2
Figure 2
Time-Point Gene Set Data Analysis. A-D. Relationship between the nature of deregulated transcripts at different time points. Deregulated transcripts (fold change ≥ 1.5) at each time point were examined for common and unique genes using a Venn diagram. Overlapping areas represent common genes between different time points. Day 1 deregulated genes were compared with day 3 and day 7 transcripts in A, and with day 14 and 56 in B. Day 3 and Day 7 deregulations were compared with both day 14 and day 56 in C and D, respectively. The transcriptome on day 1 is more similar to day 7 and less similar to days 3, 14 or 56. Additionally, day 14 and 56 deregulations are the most similar to each other with about 82% of the genes common between the two time points.
Figure 3
Figure 3
Distinct Significant Expression Profiles Clustered by STEM. A-H. Average fold change values for the genes in each cluster were plotted against the real time scale of the time-points post-injury. Error bars denote the standard deviation of the mean. Three classes of expression profiles are observed. Class I profiles (A-C) display an “up-down” pattern with the peak of up-regulation in 24 hours (profiles 45, 46 and 48) post-injury. The up-regulation is followed by decline of transcript levels, either sharply back to normal values (profiles 45 and 48) or gradually to higher than control values (profiles 46). Class II profiles (1 and 0) are quite similar to each other as they display down-regulations of many genes on day 1, which stay at lower than normal levels even at 8 weeks post-injury. Class III profiles (E-H) represent fluctuating profiles and are subdivided into two clusters. Cluster I (Profiles 44 and 41) is marked by an early increase in gene expression by day 1 followed by sudden decline in transcript level at day 3. In profile 44, this transient change in transcription level is followed by an escalating condition whereby the same transcripts are again up-regulated by day 7 and stay at higher than control values until 8 weeks post-injury. In cluster II (profile 6), a reverse phenomenon is observed, where the early event is a sharp decrease in transcript level and a follow up fluctuation pattern in gene expression. Despite fluctuations in gene expression levels, the transcript levels of genes in profiles 6 remain significantly lower than control levels throughout the course of experiment.
Figure 4
Figure 4
Time-Series Gene Ontology (GO) Enrichment Analysis of Deregulated Transcripts after SCI. A. Number of enriched GO terms as a function of fold change and p-value of enrichment parameters. Filtering criteria in STEM were set to different values between 1 and 4, and the number of Biological Process GO terms with corrected p-values of ≤ 0.001, ≤0.0001 and ≤ 0.00001 were calculated and plotted. B. Distribution of enriched GO terms with to GO levels 3–20. GO enrichment analysis was performed on transcripts with a minimum of 1.5 fold changes in expression (ANOVA t test p ≤ 0.05). This resulted in 329 and 649 enriched GO terms at p-value cutoffs of 0.0001 and 0.001, respectively. Enriched Biological Process GO categories were positioned on the directed acyclic graph (DAG) structure of the gene ontology hierarchy. The number of significant GO terms at every GO level at were plotted and also shown on top of each bar. Note that at p ≤ 0.001, no GO terms were obtained at GO levels 15–17.
Figure 5
Figure 5
REViGO Scatterplot of the Enriched GO Cluster Representatives from Time-Series Analysis. Time-series GO enrichment analysis for transcripts with a minimum of 1.5 fold change regardless of their expression profile at p-value cut off of 0.0001 led to 329 GO terms at GO level ≥3 and 267 terms at GO level ≥5. The resulting lists of 329 (A) and 267 (B) GO terms along with their p-values were further summarized by REViGO reduction analysis tool that condenses the GO description by removing redundant terms [40]. The remaining terms after the redundancy reduction were plotted in a two dimensional space. Bubble color indicates the p-value (legend in upper right-hand corner), the two ends of the colors are red and blue, depicting lower- and higher p-values respectively. Size indicates the relative frequency of the GO term in the underlying reference EBI GOA database [41]. Bubbles of more general terms are larger.
Figure 6
Figure 6
Common and Unique GO Terms between Time-Points. GO enrichment analysis was performed separately for deregulated transcripts (fold change ≥ 1.5, ANOVA t test p-value ≤ 0.05) at each time point. The enriched GO terms at a less stringent condition (p ≤ 0.05) were examined for common and unique terms using Venn diagram. All time-points were compared to each other simultaneously. Overlapping areas represent common terms between different time points. As shown, 736 terms were common to all time-points, of which 284 had a p-value ≤ 0.00001.
Figure 7
Figure 7
Temporal Pattern of Various GO Biological Processes Common to all Time-Points. A-P. Temporal pattern of change of each GO term was analyzed in order to examine the order of events after spinal cord injury. Multiple and pairwise comparisons of the enriched GO terms obtained for all time-points were made. 284 terms were found to be significantly deregulated across all time-time points post-injury (p-value ≤ 0.00001). The most specific terms were further analyzed for their gene content as well as their up- or down-regulations. The p-values of each term at various time-points were transformed to - Log10 value and plotted. Each graph depicts a single or multiple enriched GO biological process.

Similar articles

Cited by

References

    1. Park E, Velumian AA, Fehlings MG. The role of excitotoxicity in secondary mechanisms of spinal cord injury: a review with an emphasis on the implications for white matter degeneration. J Neurotrauma. 2004;21(6):754–774. doi: 10.1089/0897715041269641. - DOI - PubMed
    1. Onifer SM, Rabchevsky AG, Scheff SW. Rat models of traumatic spinal cord injury to assess motor recovery. Ilar J. 2007;48(4):385–395. doi: 10.1093/ilar.48.4.385. - DOI - PubMed
    1. Watson BD, Prado R, Dietrich WD, Ginsberg MD, Green BA. Photochemically induced spinal cord injury in the rat. Brain Res. 1986;367(1–2):296–300. - PubMed
    1. Bunge MB, Holets VR, Bates ML, Clarke TS, Watson BD. Characterization of photochemically induced spinal cord injury in the rat by light and electron microscopy. Exp Neurol. 1994;127(1):76–93. doi: 10.1006/exnr.1994.1082. - DOI - PubMed
    1. Verdu E, Garcia-Alias G, Fores J, Vela JM, Cuadras J, Lopez-Vales R, Navarro X. Morphological characterization of photochemical graded spinal cord injury in the rat. J Neurotrauma. 2003;20(5):483–499. doi: 10.1089/089771503765355559. - DOI - PubMed

Publication types