. 2013 Aug 28;33(35):14001-16.
doi: 10.1523/JNEUROSCI.1307-13.2013.

Postnatal refinement of auditory hair cell planar polarity deficits occurs in the absence of Vangl2

Affiliations

Postnatal refinement of auditory hair cell planar polarity deficits occurs in the absence of Vangl2

Catherine O Copley et al. J Neurosci. .

Abstract

The distinctive planar polarity of auditory hair cells is evident in the polarized organization of the stereociliary bundle. Mutations in the core planar cell polarity gene Van Gogh-like 2 (Vangl2) result in hair cells that fail to properly orient their stereociliary bundles along the mediolateral axis of the cochlea. The severity of this phenotype is graded along the length of the cochlea, similar to the hair cell differentiation gradient, suggesting that an active refinement process corrects planar polarity phenotypes in Vangl2 knock-out (KO) mice. Because Vangl2 gene deletions are lethal, Vangl2 conditional knock-outs (CKOs) were generated to test this hypothesis. When crossed with Pax2-Cre, Vangl2 is deleted from the inner ear, yielding planar polarity phenotypes similar to Vangl2 KOs at late embryonic stages except that Vangl2 CKO mice are viable and do not have craniorachischisis like Vangl2 KOs. Quantification of planar polarity deficits through postnatal development demonstrates the activity of a Vangl2-independent refinement process that rescues the planar polarity phenotype within 10 d of birth. In contrast, the Pax2-Cre;Vangl2 CKO has profound changes in the shape and distribution of outer pillar cell and Deiters' cell phalangeal processes that are not corrected during the period of planar polarity refinement. Auditory brainstem response analyses of adult mice show a 10-15 dB shift in auditory threshold, and distortion product otoacoustic emission measurements indicate that this mild hearing deficit is of cochlear origin. Together, these data demonstrate a Vangl2-independent refinement mechanism that actively reorients auditory stereociliary bundles and reveals an unexpected role of Vangl2 during supporting cell morphogenesis.


Figures
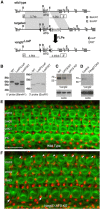
Figure 1.
Figure 1.
Vangl2 gene targeting for CKO and KO mouse production. A, The Vangl2 CKO allele was generated by flanking Vangl2 exons 2 and 3 with LoxP sequences. Exon 2 contains the translation initiation codon (ATG). An additional BamH1 restriction site was inserted along with the 5′ LoxP sequence to facilitate subsequent Southern blot assays. After germ-line transmission of the targeted allele, progeny were crossed to FlpE transgenic mice to excise the NeoR selection cassette yielding the Vangl2 LoxP allele. B, Southern blot analysis confirming proper recombination at the Vangl2 allele, the presence of 5′ and 3′ LoxP sites, and excision of the NeoR selection cassette. The position of BamHI and EcoRI restriction sites and the location of 5′ and 3′ probe binding sites used for Southern blots are indicated in A. C, Western blot analysis demonstrates the loss of Vangl2 protein from brain lysates derived from Vangl2ΔATG KO mice at E18.5. D, Western blot analysis demonstrates the efficiency of Cre-mediated gene deletion based on the loss of Vangl2 protein from cochlear epithelium of individual Pax2–Cre;Vangl2 CKO mice at P1. E, F, Auditory planar polarity visualized using phalloidin (green) and antibodies against the basal body protein Pericentrin (red) for hair cells located in the middle turn of the cochlea of E18.5 WT (D) and Vangl2ΔATG KO (E) embryos. In Vangl2 KOs, misoriented hair cells are found in the IHC row (arrows) and throughout the OHC3 (arrowheads). Scale bar, 10 μm.
Figure 2.
Figure 2.
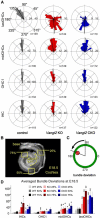
Vangl2 CKOs phenocopy Vangl2ΔATG KOs in the E18.5 organ of Corti. Vangl2 CKO mice were generated in which the Vangl2ΔATG deletion is restricted to tissues including the inner ear using Pax2–Cre. Efficacy of Vangl2 deletion on Pax2–Cre-mediated recombination was determined by quantifying the auditory planar polarity phenotypes for comparison between Vangl2 CKOs and KOs at E18.5. A, Individual stereociliary bundle orientations graphed on circular histograms for all hair cells analyzed in the middle turn of the cochlea (50% cochlear length). For these histograms, 0° is directed toward the base of the cochlea and 180° toward the apical turn. Bin width is 12°. The total number of hair cells represented by each histogram (n) is shown, and black bars mark mean stereociliary bundle orientation. B, For quantitative analyses, stereociliary bundle orientations were measured for hair cells located within three analysis fields located at positions 25, 50, and 75% along the length of the cochlea as illustrated on this low-magnification image of a fluorescently labeled E18.5 mouse cochlea. C, Schematic illustration of a single hair cell demonstrating the angular measurement used for quantifying stereociliary bundle deviation. The red dot marks the position of the basal body of the kinocilium. D, The averaged stereociliary bundle deviation from the mediolateral axis of the cochlea for Vangl2 KO, Vangl2 CKO, and control hair cells from basal (25%), middle (50%), and apical (75%) turns of the cochlea. For orientation assays, the number of mice analyzed is n = 5 (25%), 5 (50%), 5 (75%) for WT, n = 6, 6, 6 for KO, and n = 5, 5, 3 for CKO. Because Vangl2 KO cochleae frequently contain additional hair cell rows in the 75% analysis field, those hair cells located between OHC1 and the last row of OHCs (lastOHCs) were group together for analysis as middle hair cells (midOHCs). Error bars show SD, and asterisks indicate statistical significance for differences between Vangl2 CKOs or Vangl2 KOs and littermate controls of the same hair cell type and cochlear position calculated using two-tailed Student's t test with unequal variance (*p < 0.05, **p < 0.005). No significant differences between Vangl2 KO and Vangl2 CKO were identified in this analysis.
Figure 3.
Figure 3.
The gross morphology of the inner ear is unaltered in Vangl2 CKOs. Medial views of the 3D reconstructions of control (A) and Vangl2 CKO (B) inner ears at E18.5 show similar size and morphology of the endolymphatic spaces, including the length and spiral coil of the cochlea. Auditory (blue) and vestibular (red) structures were highlighted by pseudocoloring after reconstruction. C, The inner ear from Vangl2 KOs shows a reduction in size dorsoventrally and a shortened cochlear duct. Ventral views of control (D) and Vangl2 CKO (E) scala media demonstrate the similar length and number of turns of the cochlea in these genotypes. The ventral view of Vangl2 KO scala media (F) shows a reduction in the length and number of turns to the cochlea duct. Scale bars, 200 μm.
Figure 4.
Figure 4.
Auditory stereociliary bundles are reoriented through a Vangl2-independent mechanism. A, B, Hair cells labeled at P0 with phalloidin (green) and antibodies against Pericentrin (red) demonstrate the planar polarity phenotype of Vangl2 CKO mice (B), particularly in OHC3. C, D, At P4, the magnitude of the planar polarity phenotype in CKO mice is diminished and stereociliary bundle orientation appears less severely affected. E, F, For hair cells in tissue labeled between P10 and P12, planar polarity development appeared complete and stereociliary bundle orientations were more similar between Vangl2 CKOs and littermate controls. Schematics presented in A′–F′ illustrate the stereociliary bundle orientations of hair cells imaged in the primary panels. All images were collected from the 50% analysis field. Scale bars, 10 μm.
Figure 5.
Figure 5.
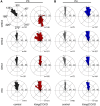
A period of auditory planar polarity refinement occurs between P0 and P4. A, B, Individual stereociliary bundle orientations for hair cells located in the 75% analysis field graphed as circular histograms from Vangl2 CKO and littermate control cochlea labeled at P0 (A) and P4 (B). In control tissues at P0, the hair cells located in OHC3 have stereociliary bundles that lean toward the apical turn of the cochlea (A). These bundles are reoriented along the mediolateral axis through a process that is completed by P4 (B). In Vangl2 CKO tissues, hair cells in OHC3 are severely affected at P0 with the majority of stereociliary bundles oriented toward the spiral ganglia (A). These bundles are also actively reoriented, as are the hair cells in the remaining rows, so that they appear more similar to littermate controls at P4 (B). For these histograms, 0° is directed toward the base of the cochlea and 180° toward the apical turn. Bin width is 12°. The total number of hair cells represented by each histogram (n) is shown, and black bars show mean stereociliary bundle orientation.
Figure 6.
Figure 6.
The extent of planar polarity refinement is graded along the length of the cochlea. A–C, Averaged stereociliary bundle deviations from the mediolateral axis for hair cells located at the 25% (A), 50% (B), and 75% (C) analysis fields from tissues collected at three stages of postnatal development. Planar polarity refinement actively reorients stereociliary bundles in the Vangl2 CKO between P0 and P4, whereas bundle polarity does not change significantly between tissues collected at P4 and P10–P12. At all ages, the differences in averaged stereociliary bundle deviation from the mediolateral axis are greatest in the most apically positioned 75% analysis field (C). Despite planar polarity refinement, IHCs and hair cells located in OHC3 remain modestly misoriented and are never as organized as the corresponding hair cells in littermate controls. The number of mice assayed at P0 is n = 4 (25%), 4 (50%), 4 (75%) for WT and n = 6, 6, 6 for CKO; at P4, n = 3, 3, 3 for WT and n = 5, 6, 6 for CKO; and at P10–P12, n = 2, 4, 6 for WT and n = 4, 4, 6 for CKO. Error bars show SD, and asterisks indicate statistical significance for differences between Vangl2 CKOs and littermate controls of the same hair cell type and cochlear position calculated using two-tailed Student's t test with unequal variance (*p < 0.05, **p < 0.005).
Figure 7.
Figure 7.
Misoriented stereociliary bundles in the apical turn of the cochlea are maintained in the adult. OHCs in the apical turn of the cochlea from littermate control (A) and Vangl2 CKO (B) mice labeled for phalloidin at P10–P12. In this position of the cochlea, the postnatal refinement of planar polarity deficits is incomplete and misoriented stereociliary bundles in OHC3 can still be identified (B, arrowheads). The loss of Vangl2 also disrupts the patterning of Deiters' cells, and their apical cell surfaces are frequently misshapen and displaced to the medial side of OHCs. Three examples of Deiters' cells are marked by asterisks in control (A) and Vangl2 CKO (B) tissues. C, D, SEM images of tissue collected at 7 weeks of age demonstrate that misoriented hair cells are maintained in OHC3 of the apical turn of the adult cochlea. OHC stereociliary bundles are pseudocolored in purple, and arrowheads mark misoriented bundles in OHC3 (D). Scale bars: A, B, 10 μm; C, D, 2 μm.
Figure 8.
Figure 8.
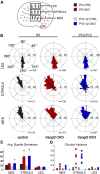
Planar polarity refinement does not occur in the utricular maculae. A, Schematic illustrating the positions of the three analysis fields relative to the position of the LPR. Hair cells in the maculae are patterned about an LPR, and, as a result, cells in the LES have stereociliary bundle orientations that are opposite of those in the striola and MES. B, Individual stereociliary bundle orientations for vestibular hair cells of the utricular maculae at P0 or between P10 and P12 graphed as circular histograms demonstrate stereociliary bundle misorientation in the striola region of the Vangl2 CKO. Unlike the case for auditory hair cells, the orientation of affected cells in the striola of Vangl2 CKO mice is not refined during the first 12 postnatal days. For these histograms, 90° is directed toward the lateral and 180° toward the medial edge of the utricular maculae, and each bin is 12°. The total number of hair cells represented by each histogram (n) is shown, and black bars mark the mean stereociliary bundle orientation. C, Averaged vestibular stereociliary bundle deviations from a polarity reference drawn perpendicular to the LPR. Error bars show SD, and asterisks indicate statistical significance for differences between Vangl2 CKOs and littermate controls of the same hair cell type and utricular position calculated using two-tailed Student's t test with unequal variance (*p < 0.025). D, The CV of stereociliary bundle orientation for hair cells located in each vestibular analysis field demonstrates the loss of coordinated orientation for hair cells located in the striola region. In this analysis, a CV value of 0 occurs for uniform bundle orientations, and each symbol represents a single analysis field. No difference in the distribution of CV values occurs between P0 and P12, indicating that active refinement does not occur in the vestibular maculae. The number of mice assayed at P0 is n = 4 for WT and n = 5 CKO, and, at P10–P12, n = 6 for WT and n = 6 for CKO. LES, Lateral extra striolar region; MES, medial extra striolar region.
Figure 9.
Figure 9.
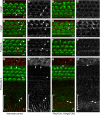
The polarized distribution of the remaining PCP proteins is disrupted in Vangl2 CKOs. A, A′, Vangl1 protein visualized by immunofluorescence (red) is asymmetrically localized in the P1 organ of Corti, including the cell boundaries between OHCs and the adjacent Deiters' cells (examples indicated by arrowheads) and at the boundaries between IPCs and inner phalangeal cells (example indicated by arrow). A′, Grayscale image of A shows the asymmetric distribution of Vangl1 at these cell boundaries. B, B′, In Vangl2 CKOs, Vangl1 localization is disrupted and Vangl1 protein is no longer enriched at cell boundaries. C, D, At P5, the level of Vangl1 expression is increased in littermate controls (C, examples illustrated by arrowheads) and Vangl2 CKOs (D). Despite this, Vangl1 is never asymmetrically localized at hair cell boundaries after OHC reorientation (D, examples illustrated by arrowheads). E, The transmembrane receptor Fz6 (red) is asymmetrically localized in auditory hair cells at P1 to the medial boundary between OHCs and the adjacent Deiters' cells and at the boundaries between IPCs and inner phalangeal cells (examples indicated by arrowheads). E′, Grayscale image of E shows the asymmetric distribution of Fz6 at cell boundaries. F, F′, In Vangl2 CKOs, Fz6 localization to cell boundaries is disrupted (F′) and appears as immunofluorescence puncta throughout the organ of Corti. G, G′, The Vangl2-associated protein Pk2 (red) is enriched in nonsensory cells flanking the organ of Corti, including the Hensons' cells (asterisks mark two examples) and cells of the inner sulcus (bracketed region). In both cell types, Pk2 is enriched at cell boundaries oriented perpendicular to the hair cell rows (vertical arrows). Within the organ of Corti, Pk2 is enriched along one edge of the IPCs (arrowhead). G′, Grayscale image of G shows the asymmetric distributions of Pk2 at these cell boundaries. H, H′, In Vangl2 CKOs, the polarized distribution of Pk2 is disrupted with Pk2 frequently redistributed throughout the cell periphery (horizontal arrows). Pk2 expression in the IPCs is also significantly reduced. For all primary panels, hair cell stereociliary bundles and the actin-rich cortical belts surrounding hair cells and supporting cells are labeled with phalloidin (green). Scale bar, 10 μm.
Figure 10.
Figure 10.
Loss of Vangl2 results in changes in organ of Corti supporting cell morphology. A, B, Phalloidin (green) and immunofluorescent β1β2-tubulin (red) labeling of P10–P12 organ of Corti in the 75% analysis field shows the distribution of hair cells and the morphology of supporting cells. The orientation of these panels has been inverted on the y-axis to highlight the orientation of supporting cells. A′, β1β2-Tubulin in control tissues marks the apical surface of IPCs (bracketed region), the apical surface of OPCs that separate hair cells in the OHC1 row (examples marked by arrows), and the phalangeal processes of Deiters' cells (examples marked by arrowheads). Asterisks mark the position of three Deiters' cells positioned between hair cells of the OHC2 row. A″, Phalloidin only labels the actin-rich apical surface of the IPCs and the hair cells. B′, In Vangl2 CKO tissues, changes in the morphology of cochlear supporting cells are evident by β1β2-tubulin labeling. This includes the displacement of some OPC processes to the medial side of OHCs (arrows highlight examples) and Deiters' cell phalangeal processes that fail to extend toward the apical turn (arrowheads highlight examples). B″, Changes in the distribution of the apical surface of supporting cells are also revealed by phalloidin labeling of cell boundaries, including the OPCs (arrowheads) and Deiters' cells (asterisks). C–E, Individual Deiters' cell morphology at P8–P10 stages in littermate control (C) and two Vangl2 CKO cochleae (D, E) visualized by intracellular injection of Alexa Fluor 488. Asterisks indicate the position of the cell body, and arrows (C, D) indicate the apical surface of the phalangeal process. In the absence of Vangl2, the phalangeal process of some Deiters' cells project directly toward the apical surface of the organ of Corti rather than laterally toward neighboring hair cells. The arrowhead in E illustrates a process that is misplaced to the medial side of the OHC. Brackets demarcate the length of the Deiters' cell process. Scale bars, 20 μm.
Figure 11.
Figure 11.
ABR and DPOAE analyses demonstrate reduced auditory sensitivity in Vangl2 CKOs. A, The averaged ABR waveform collected from littermate control and Vangl2 CKO mice between 6 and 8 weeks of age in response to click stimuli. CKO animals have decreased waveform amplitude and increased response threshold. B, The threshold of the ABR response to click stimuli or tones at fixed frequencies. C, The peak amplitude of ABR wave 1 measured from P1 (arrow in A) to N2 (arrowhead in A) in response to clicks or tones of increasing sound intensity. The amplitude of the response is reduced for all stimuli. D, DPOAE measurements of the amplitude of the distortion product in response to f2 stimulus of increasing sound pressure level. The decreased amplitude of the distortion product in Vangl2 CKO animals suggests that hearing deficits in these animals stem from changes in OHC activity and/or function of the cochlear amplifier. In each graph, the responses of Vangl2 CKO animals are red. The number of mice assayed for ABR is n = 10 for controls and n = 8 for CKOs, and for DPOAEs is 8 for controls and n = 5 for CKOs. Error bars show SD, and asterisks indicate statistical significance for differences between littermate controls and Vangl2 CKOs using two-tailed Student's t test with unequal variance (*p < 0.05, **p < 0.005).

Similar articles

Cited by

References

    1. Andre P, Wang Q, Wang N, Gao B, Schilit A, Halford MM, Stacker SA, Zhang X, Yang Y. The Wnt coreceptor Ryk regulates Wnt/planar cell polarity by modulating the degradation of the core planar cell polarity component Vangl2. J Biol Chem. 2012;287:44518–44525. doi: 10.1074/jbc.M112.414441. - DOI - PMC - PubMed
    1. Belotti E, Puvirajesinghe TM, Audebert S, Baudelet E, Camoin L, Pierres M, Lasvaux L, Ferracci G, Montcouquiol M, Borg JP. Molecular characterisation of endogenous Vangl2/Vangl1 heteromeric protein complexes. PLoS One. 2012;7:e46213. doi: 10.1371/journal.pone.0046213. - DOI - PMC - PubMed
    1. Burns JC, Collado MS, Oliver ER, Corwin JT. Specializations of intercellular junctions are associated with the presence and absence of hair cell regeneration in ears from six vertebrate classes. J Comp Neurol. 2013;521:1430–1448. doi: 10.1002/cne.23250. - DOI - PubMed
    1. Collado MS, Thiede BR, Baker W, Askew C, Igbani LM, Corwin JT. The postnatal accumulation of junctional E-cadherin is inversely correlated with the capacity for supporting cells to convert directly into sensory hair cells in mammalian balance organs. J Neurosci. 2011;31:11855–11866. doi: 10.1523/JNEUROSCI.2525-11.2011. - DOI - PMC - PubMed
    1. Cotanche DA, Corwin JT. Stereociliary bundles reorient during hair cell development and regeneration in the chick cochlea. Hear Res. 1991;52:379–402. doi: 10.1016/0378-5955(91)90027-7. - DOI - PubMed

Publication types