

Optimal multimodal integration in spatial localization
- PMID: 23986259
- PMCID: PMC3756764
- DOI: 10.1523/JNEUROSCI.0523-13.2013
Optimal multimodal integration in spatial localization
Abstract
Saccadic eye movements facilitate rapid and efficient exploration of visual scenes, but also pose serious challenges to establishing reliable spatial representations. This process presumably depends on extraretinal information about eye position, but it is still unclear whether afferent or efferent signals are implicated and how these signals are combined with the visual input. Using a novel gaze-contingent search paradigm with highly controlled retinal stimulation, we examined the performance of human observers in locating a previously fixated target after a variable number of saccades, a task that generates contrasting predictions for different updating mechanisms. We show that while localization accuracy is unaffected by saccades, localization precision deteriorates nonlinearly, revealing a statistically optimal combination of retinal and extraretinal signals. These results provide direct evidence for optimal multimodal integration in the updating of spatial representations and elucidate the contributions of corollary discharge signals and eye proprioception.
Figures


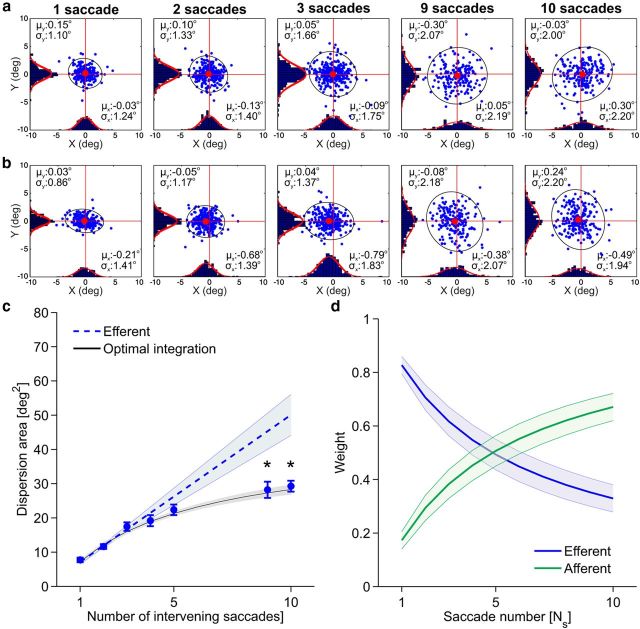
 (μ, σ) (red curves). Data from all subjects (N = 4) were pooled together. b, Same data as in a after rotating the axes to align the abscissa with the cue-target direction. c, Mean dispersion area across subjects as a function of the number of saccades. Asterisks mark significant deviations (p < 0.001, two-tailed paired t tests), from the predictions of a purely efferent estimate, as given by the linear regression of the measurements obtained with the first three saccades (blue line). The black curve represents the least-squares fit of the ideal observer model. d, Optimal weighting of afferent and efferent estimates. As the number of saccades increases, proprioception is weighted more strongly and eventually becomes the predominant source of information. Error bars and shaded regions in c and d represent SEM.
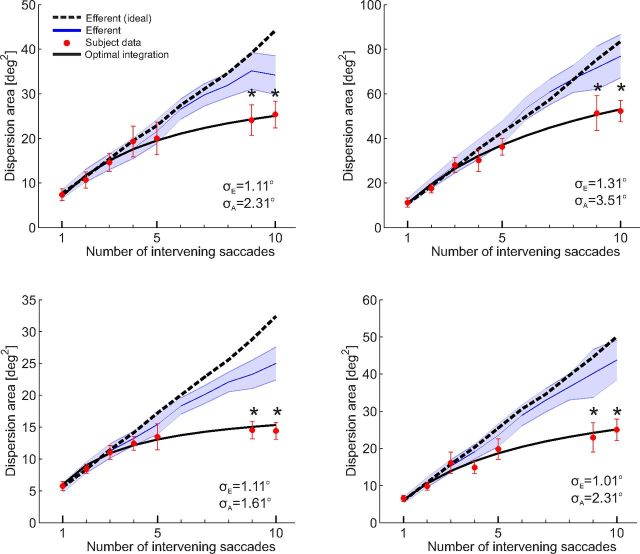


Similar articles
-
Visual signals contribute to the coding of gaze direction.Exp Brain Res. 2002 Jun;144(3):281-92. doi: 10.1007/s00221-002-1029-5. Epub 2002 Apr 13. Exp Brain Res. 2002. PMID: 12021810
-
A computational model for the influence of corollary discharge and proprioception on the perisaccadic mislocalization of briefly presented stimuli in complete darkness.J Neurosci. 2011 Nov 30;31(48):17392-405. doi: 10.1523/JNEUROSCI.3407-11.2011. J Neurosci. 2011. PMID: 22131401 Free PMC article.
-
Absence of spatial updating when the visuomotor system is unsure about stimulus motion.J Neurosci. 2011 Jul 20;31(29):10558-68. doi: 10.1523/JNEUROSCI.0998-11.2011. J Neurosci. 2011. PMID: 21775600 Free PMC article.
-
Control and Functions of Fixational Eye Movements.Annu Rev Vis Sci. 2015 Nov;1:499-518. doi: 10.1146/annurev-vision-082114-035742. Epub 2015 Oct 14. Annu Rev Vis Sci. 2015. PMID: 27795997 Free PMC article. Review.
-
A physiological perspective on fixational eye movements.Vision Res. 2016 Jan;118:31-47. doi: 10.1016/j.visres.2014.12.006. Epub 2014 Dec 20. Vision Res. 2016. PMID: 25536465 Free PMC article. Review.
Cited by
-
Bilateral increase in MEG planar gradients prior to saccade onset.Sci Rep. 2023 Apr 10;13(1):5830. doi: 10.1038/s41598-023-32980-z. Sci Rep. 2023. PMID: 37037892 Free PMC article.
-
Influence of duration and visual feedback on the perception of tactile illusions of motion.Sci Rep. 2025 Mar 31;15(1):10965. doi: 10.1038/s41598-025-95527-4. Sci Rep. 2025. PMID: 40164678 Free PMC article.
-
Brain representations of motion and position in the double-drift illusion.Elife. 2024 May 29;13:e76803. doi: 10.7554/eLife.76803. Elife. 2024. PMID: 38809774 Free PMC article.
-
Spatiotemporal Content of Saccade Transients.Curr Biol. 2020 Oct 19;30(20):3999-4008.e2. doi: 10.1016/j.cub.2020.07.085. Epub 2020 Sep 10. Curr Biol. 2020. PMID: 32916116 Free PMC article.
-
Intra-saccadic displacement sensitivity after a lesion to the posterior parietal cortex.Cortex. 2020 Jun;127:108-119. doi: 10.1016/j.cortex.2020.01.027. Epub 2020 Feb 19. Cortex. 2020. PMID: 32172025 Free PMC article.
References
-
- Akaike H. A new look at the statistical model identification. IEEE Trans Automat Control. 1974;19:716–723. doi: 10.1109/TAC.1974.1100705. - DOI
-
- Allin F, Velay JL, Bouquerel A. Shift in saccadic direction induced in humans by proprioceptive manipulation: a comparison between memory-guided and visually guided saccades. Exp Brain Res. 1996;110:473–481. - PubMed
Publication types
MeSH terms
Grants and funding
LinkOut - more resources
Full Text Sources
Other Literature Sources