

Trimodal detection of early childhood caries using laser light scanning and fluorescence spectroscopy: clinical prototype
- PMID: 23986369
- PMCID: PMC4030691
- DOI: 10.1117/1.JBO.18.11.111412
Trimodal detection of early childhood caries using laser light scanning and fluorescence spectroscopy: clinical prototype
Abstract
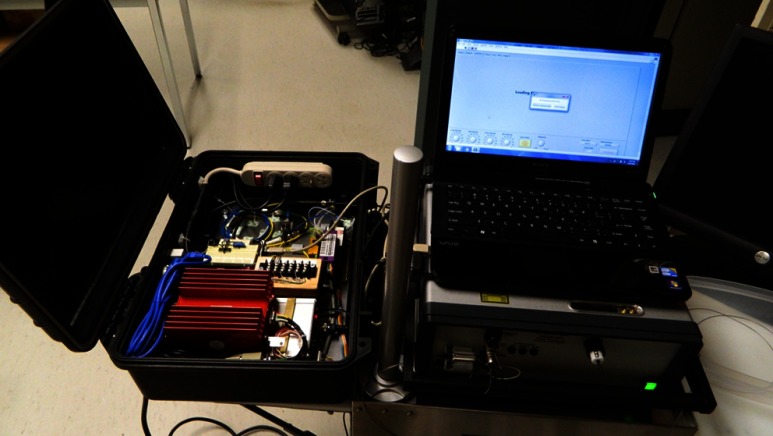
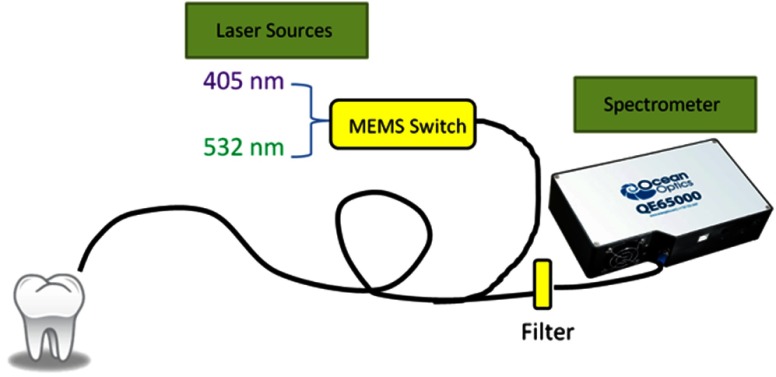
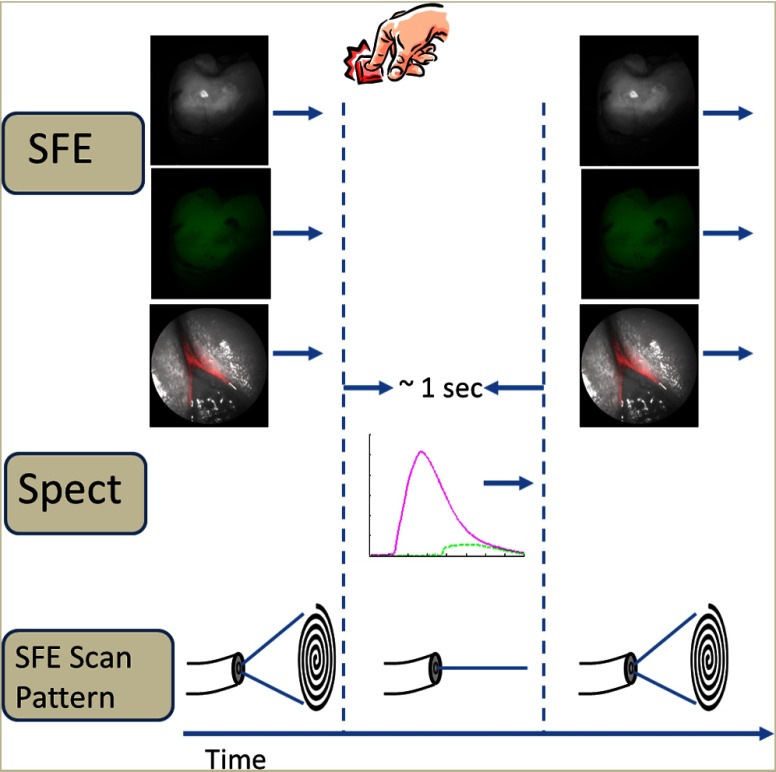
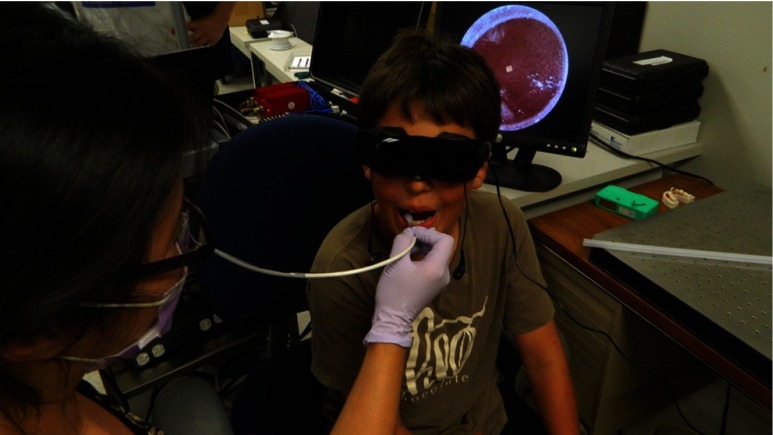
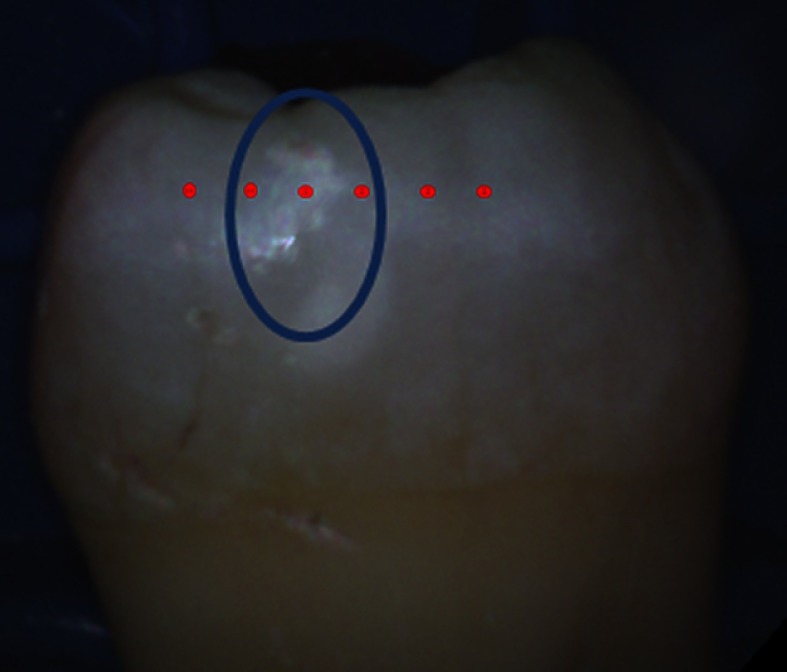
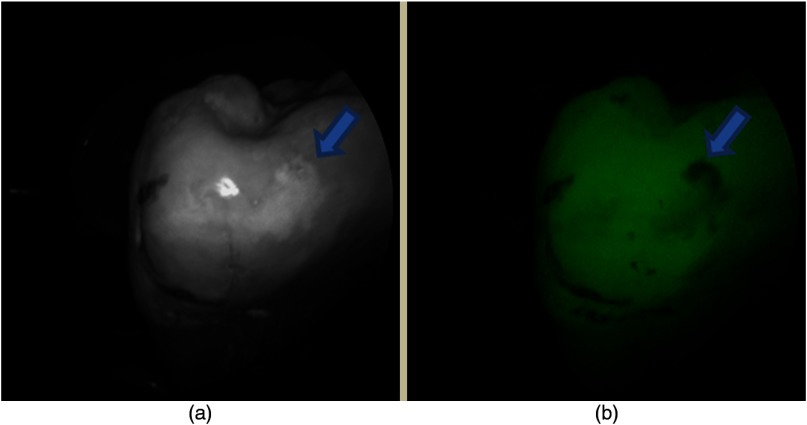
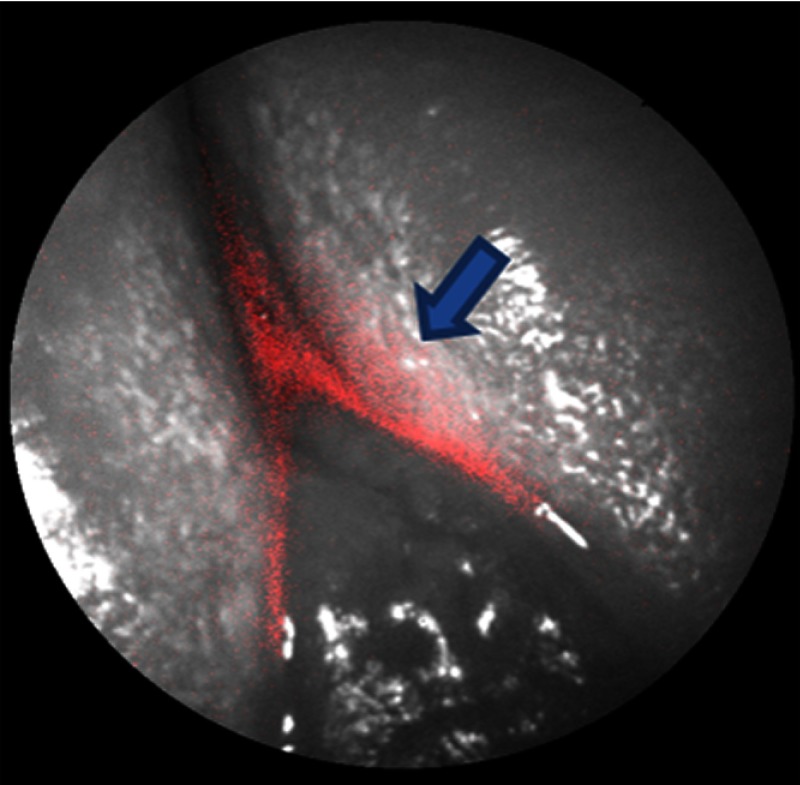
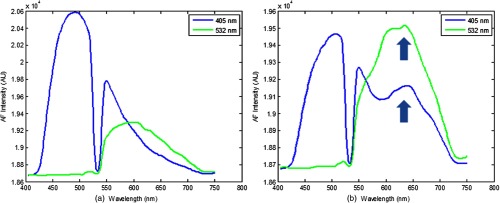
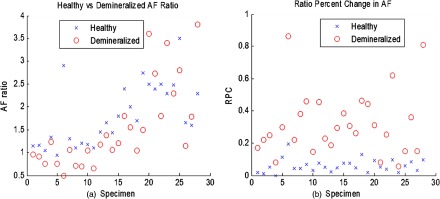
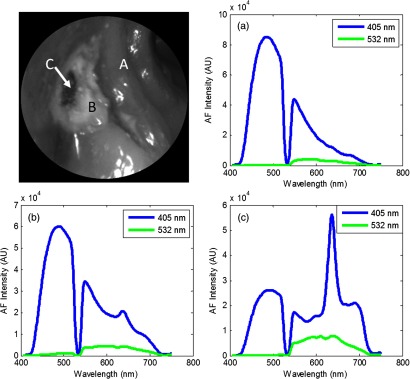
There is currently a need for a safe and effective way to detect and diagnose early stages of childhood caries. A multimodal optical clinical prototype for diagnosing caries demineralization in vivo has been developed. The device can be used to quickly image and screen for any signs of demineralized enamel by obtaining high-resolution and high-contrast surface images using a 405-nm laser as the illumination source, as well as obtaining autofluorescence and bacterial fluorescence images. When a suspicious region of demineralization is located, the device also performs dual laser fluorescence spectroscopy using 405- and 532-nm laser excitation. An autofluorescence ratio of the two excitation lasers is computed and used to quantitatively diagnose enamel health. The device was tested on five patients in vivo as well as on 28 extracted teeth with clinically diagnosed carious lesions. The device was able to provide detailed images that highlighted the lesions identified by the clinicians. The autofluorescence spectroscopic ratios obtained from the extracted teeth successfully quantitatively discriminated between sound and demineralized enamel.
© 2013 Society of Photo-Optical Instrumentation Engineers (SPIE)
Figures
Similar articles
-
Early differentiation between caries and tooth demineralization using laser-induced autofluorescence spectroscopy.Lasers Surg Med. 2004;34(3):249-53. doi: 10.1002/lsm.20009. Lasers Surg Med. 2004. PMID: 15022252
-
Comparative study to quantify demineralized enamel in deciduous and permanent teeth using laser- and light-induced fluorescence techniques.Caries Res. 2001 Nov-Dec;35(6):464-70. doi: 10.1159/000047491. Caries Res. 2001. PMID: 11799288
-
Classification of dental diseases using hyperspectral imaging and laser induced fluorescence.Photodiagnosis Photodyn Ther. 2019 Mar;25:128-135. doi: 10.1016/j.pdpdt.2018.11.017. Epub 2018 Nov 27. Photodiagnosis Photodyn Ther. 2019. PMID: 30500670
-
Quantitative light fluorescence: a technology for early monitoring of the caries process.Dent Clin North Am. 2005 Oct;49(4):753-70, vi. doi: 10.1016/j.cden.2005.05.009. Dent Clin North Am. 2005. PMID: 16150315 Review.
-
Early caries imaging and monitoring with near-infrared light.Dent Clin North Am. 2005 Oct;49(4):771-93, vi. doi: 10.1016/j.cden.2005.05.008. Dent Clin North Am. 2005. PMID: 16150316 Review.
Cited by
-
Diagnosis and staging of caries using spectral factors derived from the blue laser-induced autofluorescence spectrum.J Dent. 2017 Dec;67:77-83. doi: 10.1016/j.jdent.2017.09.015. Epub 2017 Oct 6. J Dent. 2017. PMID: 28993243 Free PMC article.
-
Multimodal laser-based angioscopy for structural, chemical and biological imaging of atherosclerosis.Nat Biomed Eng. 2017;1:0023. doi: 10.1038/s41551-016-0023. Epub 2017 Feb 10. Nat Biomed Eng. 2017. PMID: 28555172 Free PMC article.
-
Towards AR-assisted visualisation and guidance for imaging of dental decay.Healthc Technol Lett. 2019 Nov 26;6(6):243-248. doi: 10.1049/htl.2019.0082. eCollection 2019 Dec. Healthc Technol Lett. 2019. PMID: 32038865 Free PMC article.
-
Near-Infrared Imaging of Artificial Enamel Caries Lesions with a Scanning Fiber Endoscope.Sensors (Basel). 2019 Mar 22;19(6):1419. doi: 10.3390/s19061419. Sensors (Basel). 2019. PMID: 30909442 Free PMC article.
-
Semi-autonomous image-guided brain tumour resection using an integrated robotic system: A bench-top study.Int J Med Robot. 2018 Feb;14(1):10.1002/rcs.1872. doi: 10.1002/rcs.1872. Epub 2017 Nov 3. Int J Med Robot. 2018. PMID: 29105281 Free PMC article.
References
-
- Bagramian R., Garcia-Godoy F., Volpe A., “The global increase in dental caries. A pending public health crisis,” Am. J. Dent. 21(1), 3–8 (2009). - PubMed
-
- Virajsilp V., et al. , “Comparison of proximal caries detection in primary teeth between laser fluorescence and bitewing radiography,” Pediatr. Dent. 27(6), 493–499 (2005).PEDEDL - PubMed
Publication types
MeSH terms
Grants and funding
LinkOut - more resources
Full Text Sources
Other Literature Sources
Medical
