. 2013 Oct 18;288(42):30094-30104.
doi: 10.1074/jbc.M113.494286. Epub 2013 Aug 28.

Cathepsin B contributes to autophagy-related 7 (Atg7)-induced nod-like receptor 3 (NLRP3)-dependent proinflammatory response and aggravates lipotoxicity in rat insulinoma cell line

Affiliations

Cathepsin B contributes to autophagy-related 7 (Atg7)-induced nod-like receptor 3 (NLRP3)-dependent proinflammatory response and aggravates lipotoxicity in rat insulinoma cell line

Shali Li et al. J Biol Chem. .

Abstract

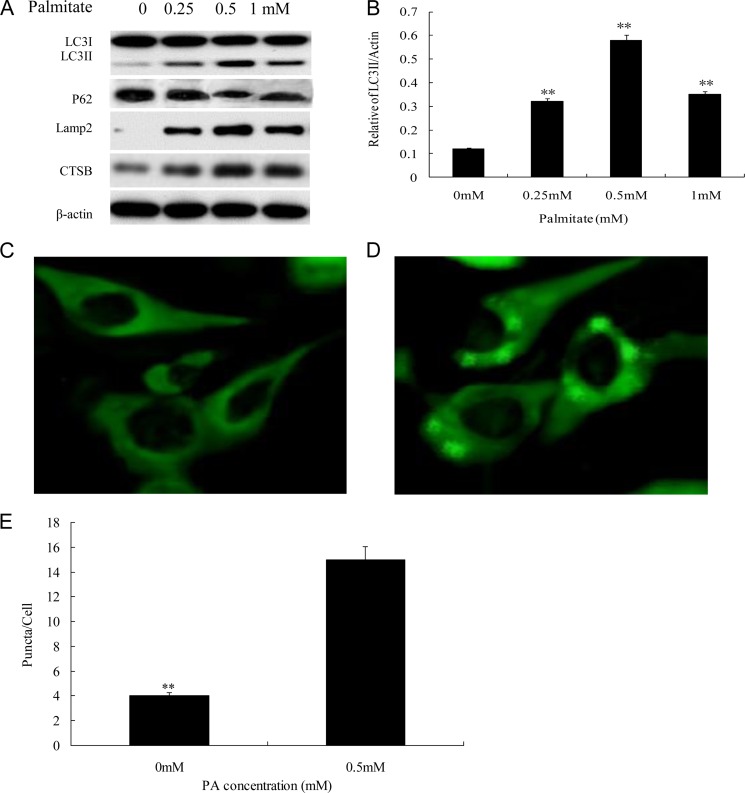
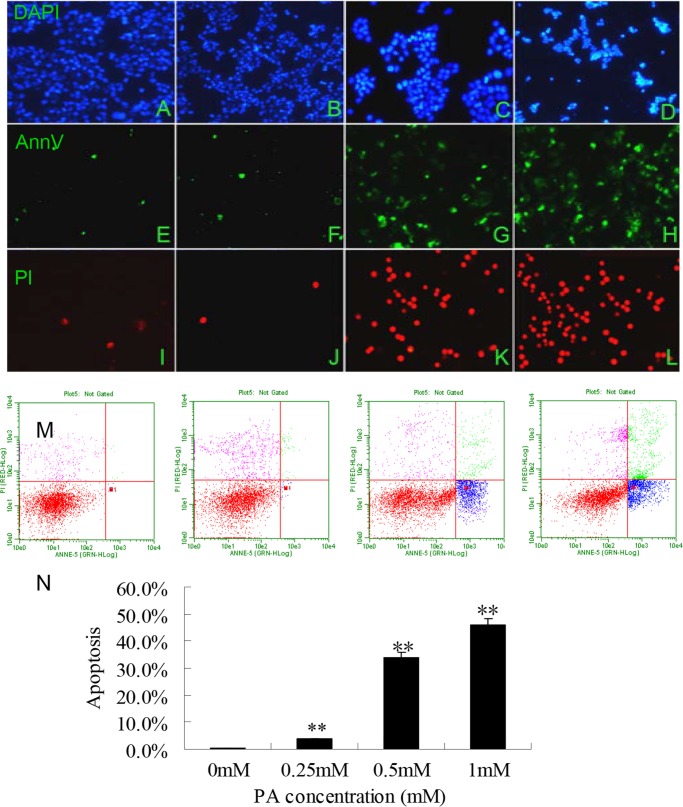
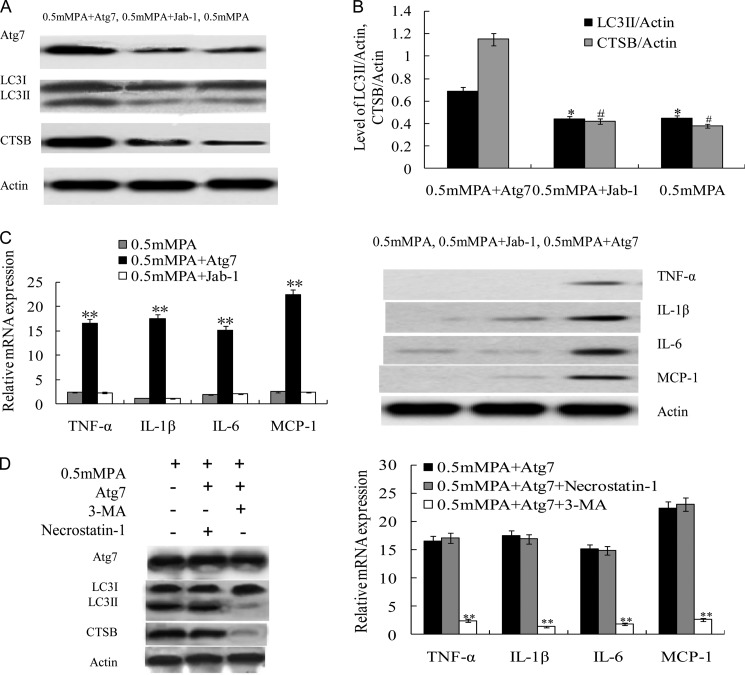
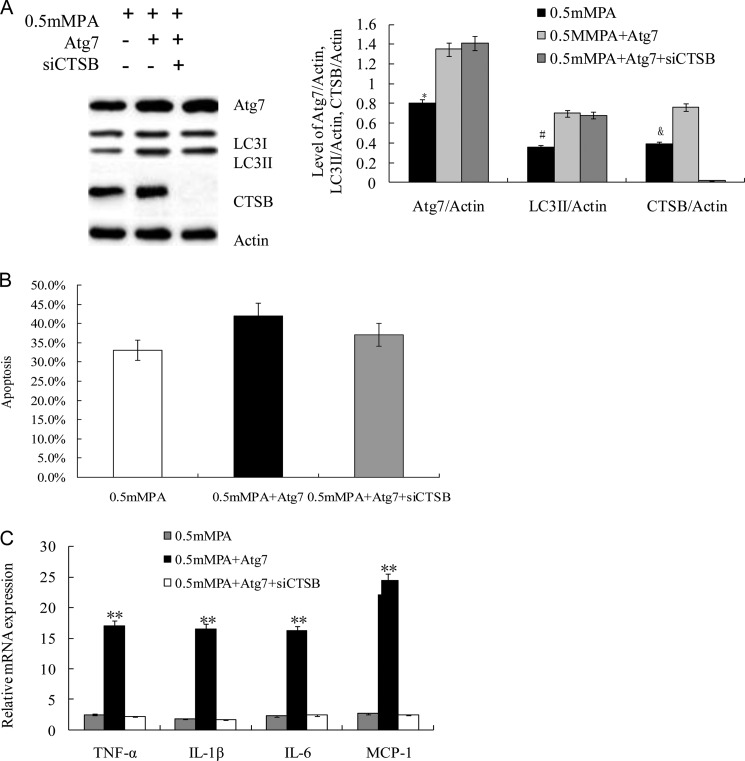
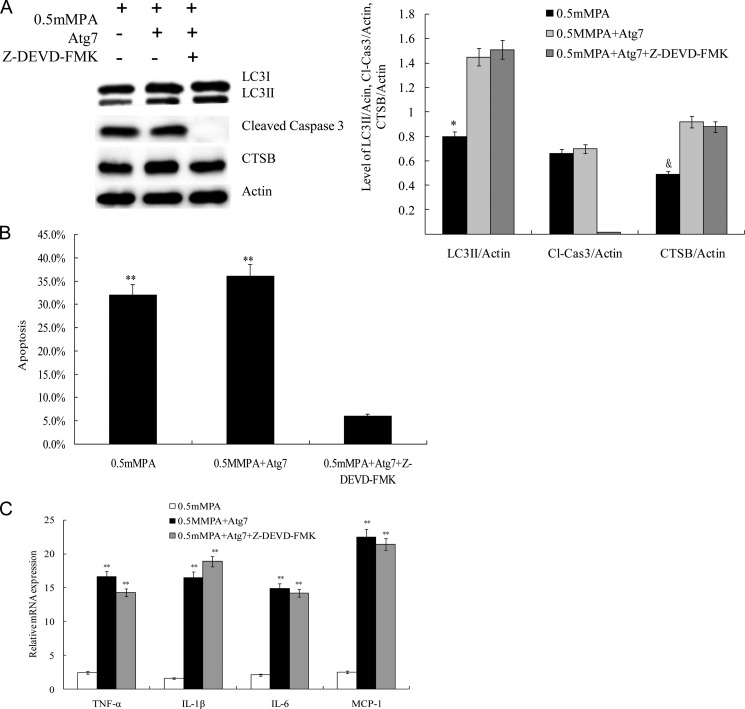
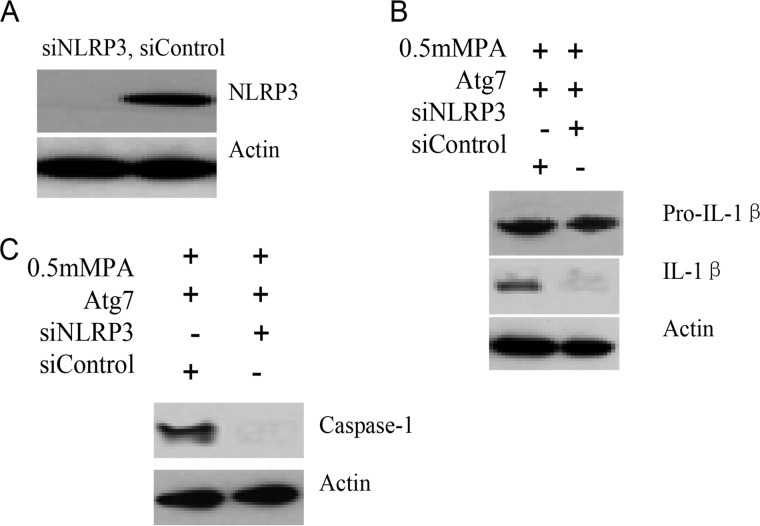
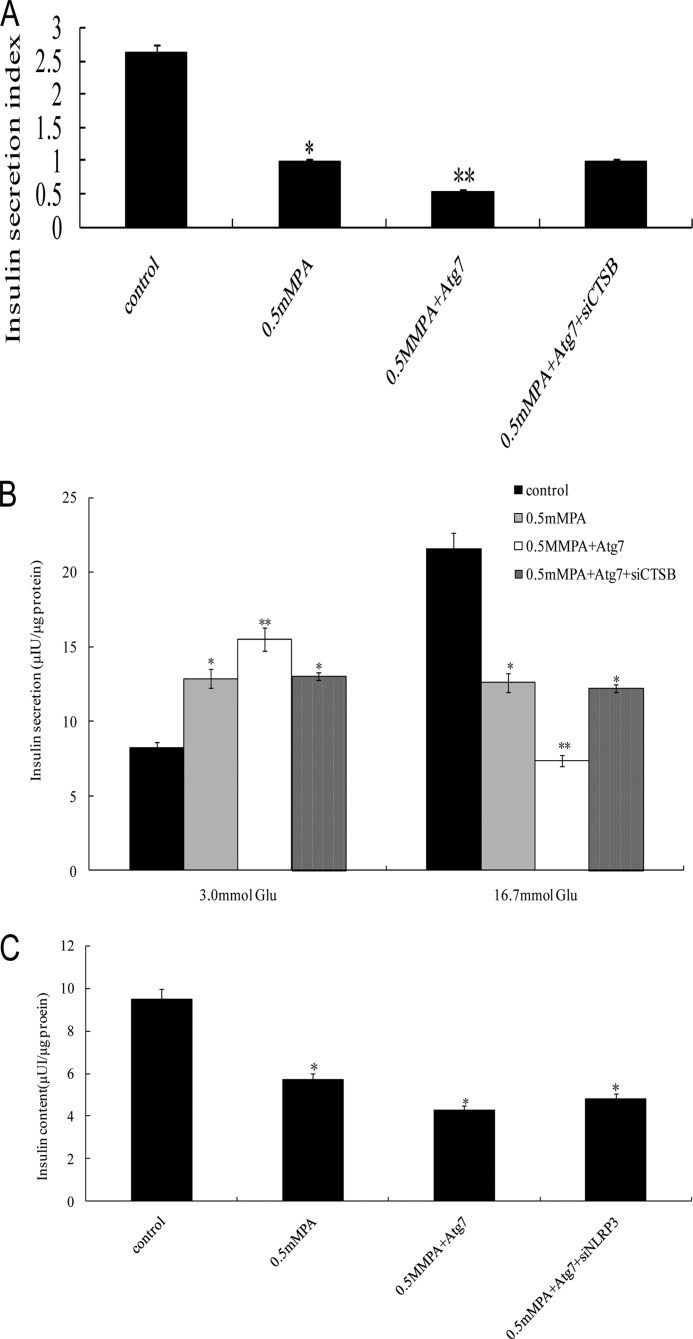
Impairment of glucose-stimulated insulin secretion caused by the lipotoxicity of palmitate was found in β-cells. Recent studies have indicated that defects in autophagy contribute to pathogenesis in type 2 diabetes. Here, we report that autophagy-related 7 (Atg7) induced excessive autophagic activation in INS-1(823/13) cells exposed to saturated fatty acids. Atg7-induced cathepsin B (CTSB) overexpression resulted in an unexpected significant increase in proinflammatory chemokine and cytokine production levels of IL-1β, monocyte chemotactic protein-1, IL-6, and TNF-α. Inhibition of receptor-interacting protein did not affect the inflammatory response, ruling out involvement of necrosis. CTSB siRNA suppressed the inflammatory response but did not affect apoptosis significantly, suggesting that CTSB was a molecular linker between autophagy and the proinflammatory response. Blocking caspase-3 suppressed apoptosis but did not affect the inflammatory response, suggesting that CTSB induced inflammatory effects independently of apoptosis. Silencing of Nod-like receptor 3 (NLRP3) completely abolished both IL-1β secretion and the down-regulation effects of Atg7-induced CTSB overexpression on glucose-stimulated insulin secretion impairment, thus identifying the NLRP3 inflammasome as an autophagy-responsive element in the pancreatic INS-1(823/13) cell line. Combined together, our results indicate that CTSB contributed to the Atg7-induced NLRP3-dependent proinflammatory response, resulting in aggravation of lipotoxicity, independently of apoptosis in the pancreatic INS-1(823/13) cell line.

Keywords: Autophagy; Cytokine; Glucose Metabolism; Inflammation; Insulin Resistance; Pancreatic Islets.


Figures

FIGURE 1.
FIGURE 1.
0.5 mm PA stimulated proper autophagy activation in INS-1(823/13) cells. A, PA stimulated expression of autophagy activation-associated proteins LC3II/LC3I, p62, lysosome-associated membrane protein (Lamp2), and CTSB. INS-1(823/13) cells treated with 0, 0.25, 0.5, and 1 mm PA were analyzed by immunoblotting. β-Actin was used as a control. B, ratio of LC3II/actin was analyzed in INS-1(823/13) cells treated with 0, 0.25, 0.5, and 1 mm PA for 12 h (**, p < 0.01). C and D, cells stained with LC3 antibody followed by secondary antibody (green) were visualized by confocal microscopy. INS-1(823/13) cells treated with 0.5 mm PA (D) were compared with control (0 mm PA) (C). E, the number of cytoplasmic puncta/cell is shown. Data are expressed as mean ± S.D. (error bars) from three independent experiments (analyzed by t test; **, p < 0.01 compared with control group).
FIGURE 2.
FIGURE 2.
0.5 mm PA induced appropriate INS cell apoptosis as assessed by morphological and FACS analyses. A–L, images of representative fields were captured at a magnification of 40× under fluorescence microscope (Nikon microscope, Japan). INS-1(823/13) cells treated with 0, 0.25, 0.5, and 1 mm PA (from left to right) and stained with DAPI (A–D), Annexin V (AnnV; E–H), and PI (I–L) were observed under a fluorescence microscope. M, the induction of apoptosis was determined by flow cytometric analysis of Annexin V-FITC and PI staining after treatment with 0, 0.25, 0.5, and 1 mm PA (starting from left to right). Cells in the lower right quadrant are Annexin-positive, early apoptotic cells. The cells in the upper right quadrant are Annexin-positive/PI-positive, late apoptotic cells. N, the percentages of INS-1(823/13) cell apoptosis showing a greater but appropriate degree of apoptosis in the 0.5 mm PA group compared with the control and the group treated with 1 mm PA. The data are expressed as the mean ± S.D. (error bars) of three to five independent experiments with each condition performed in duplicate (**, p < 0.01).
FIGURE 3.
FIGURE 3.
Atg7-induced excessive autophagy activation potentiated inflammatory cytokine production in INS-1(823/13) cells exposed to PA. A, Atg7 transfection induced excessive autophagy activation. The Atg7-transfected 0.5 mm PA-treated (Atg7 + 0.5 mm) group showed increased Atg7, LC3II, and CTSB expression compared with control treated with 0.5 mm PA or mock control (Jab-1 + 0.5 mm PA). B, relative levels of LC3II/actin and CTSB/actin were significantly higher in the 0.5 mm PA + Atg7 group compared with both the 0.5 mm PA group and the 0.5 mm PA + Jab-1 group (* and #, p < 0.05) (n = 6). C, relative mRNA expression levels of the proinflammatory cytokines TNF-α, IL-1β, IL-6, and MCP-1 were determined by real time PCR. Data are expressed as the mean ± S.D. (error bars) (**, p < 0.01) (n = 6). The protein levels of proinflammatory cytokines were examined by Western blot of the INS-1(823/13) cells in the 0.5 mm PA group, the 0.5 mm PA + Atg7 group, and the 0.5 mm PA + Jab-1 group. D, representative Western blot showing protein expression levels of Atg7 and LC3II/LC3I of cells that were incubated for 8 h with 0.5 mm PA + Atg7 in the presence of 10 mm 3-methyladenine (3-MA) or 30 μm necrostatin-1 (left panel). Relative mRNA expression levels of the proinflammatory cytokines TNF-α, IL-1β, IL-6, and MCP-1 were determined by real time PCR (right panel). Data are expressed as the mean ± S.D. (error bars) (**, p < 0.01) (n = 6).
FIGURE 4.
FIGURE 4.
Blockage of CTSB suppressed Atg7-induced inflammatory response. A, CTSB expression was completely inhibited by siRNA. The protein expression levels of Atg7 and CTSB and the ratio of LC3II/LC3I were assayed by Western blot analysis using cell-free lysates prepared from the culture. Actin was used as a loading control. Levels of Atg7/actin, LC3II/actin, and CTSB/actin were analyzed in INS-1(823/13) cells treated with 0.5 mm PA, Atg7 + 0.5 mm PA, and (Atg7 + 0.5 mm PA + siCTSB, respectively (*, #, and &, p < 0.05) (n = 6). B, cell apoptosis was determined by FACS in the 0.5 mm PA group, Atg7 + 0.5 mm PA group, and Atg7 + 0.5 mm PA + siCTSB group. There were no significant differences among them, although siRNA caused a lower trend of apoptosis. C, relative levels of mRNA of the proinflammatory cytokines were determined by real time PCR. Data are expressed as the mean ± S.D. (error bars) (**, p < 0.01) (n = 6).
FIGURE 5.
FIGURE 5.
The caspase-3 inhibitor Z-DEVD-fmk suppressed apoptosis but did not affect inflammatory response. A, caspase-3 was completely inhibited by Z-DEVD-fmk (50 μm). The protein expression levels of caspase-3 and CTSB and the ratio of LC3II/LC3I were assayed by Western blot analysis using cell-free lysates prepared from the culture. Actin was used as a loading control. Levels of LC3II/actin, cleaved caspase-3 (Cl-Cas3)/actin, and CTSB/actin were analyzed in INS-1(823/13) cells treated with 0.5 mm PA, Atg7 + 0.5 mm PA, and Atg7 + 0.5 mm PA + Z-DEVD-fmk, respectively (* and &, p < 0.05) (n = 6). B, INS-1(823/13) cell apoptosis under three different treatments was determined by FACS (**, p < 0.01) (n = 6). C, relative levels of mRNA of the proinflammatory cytokines of the three groups were determined by real time PCR. Data are expressed as the mean ± S.D. (error bars) (**, p < 0.01) (n = 6).
FIGURE 6.
FIGURE 6.
NLRP3 knockdown blocked Atg7-induced proinflammatory response. A, INS-1(823/13) cells were stably transfected with siRNA that targets NLRP3, and protein levels of NLRP3 knockdown cells were analyzed by Western blot analysis. NLRP3 or non-target control (siControl) knockdown cells were treated with 0.5 mm PA and transfected with Atg7. Secreted IL-1β (B) and activated caspase-1 (C) were examined by Western blot analysis. Taken together, these data reveal that excessive autophagy activity induced caspase-1 activation and cytokine secretion through an NLRP3-dependent pathway.
FIGURE 7.
FIGURE 7.
Atg7-induced excessive autophagy activation induced severe impairment of GSIS function. After equilibration at 3.3 mm glucose, INS-1(823/13) cells were stimulated with high glucose (16.7 mm) for 1 h. A, the glucose-stimulated insulin secretion in INS-1(823/13) cells was measured by RIA, and then the insulin secretion index was calculated (insulin release at high glucose/insulin release at basal glucose) (*, p < 0.05; **, p < 0.01) (n = 6). B, the insulin secretion in INS-1(823/13) cells in response to 3.0 and 16.7 mm glucose stimulation was examined (*, p < 0.05; **, p < 0.01) (n = 6). C, total insulin content in INS-1(823/13) cells was extracted by the acid/ethanol method and detected using an RIA kit. Data are expressed as the mean ± S.D. (error bars) (*, p < 0.05) (n = 6).

References

    1. Shao S., Liu Z., Yang Y., Zhang M., Yu X. (2010) SREBP-1c, Pdx-1, and GLP-1R involved in palmitate-EPA regulated glucose-stimulated insulin secretion in INS-1 cells. J. Cell. Biochem. 111, 634–642 - PubMed
    1. Gregor M. F., Hotamisligil G. S. (2011) Inflammatory mechanisms in obesity. Annu. Rev. Immunol. 29, 415–445 - PubMed
    1. Donath M. Y., Shoelson S. E. (2011) Type 2 diabetes as an inflammatory disease. Nat. Rev. Immunol. 11, 98–107 - PubMed
    1. Festa A., D'Agostino R., Jr., Tracy R. P., Haffner S. M. (2002) Elevated levels of acute-phase proteins and plasminogen activator inhibitor-1 predict the development of type 2 diabetes: the insulin resistance atherosclerosis study. Diabetes 51, 1131–1137 - PubMed
    1. Osborn O., Brownell S. E., Sanchez-Alavez M., Salomon D., Gram H., Bartfai T. (2008) Treatment with an Interleukin 1β antibody improves glycemic control in diet-induced obesity. Cytokine 44, 141–148 - PMC - PubMed

MeSH terms