. 2013 Sep 17;110(38):15259-64.
doi: 10.1073/pnas.1305687110. Epub 2013 Aug 28.

Regulatory flexibility in the Nrf2-mediated stress response is conferred by conformational cycling of the Keap1-Nrf2 protein complex

Affiliations

Regulatory flexibility in the Nrf2-mediated stress response is conferred by conformational cycling of the Keap1-Nrf2 protein complex

Liam Baird et al. Proc Natl Acad Sci U S A. .

Abstract

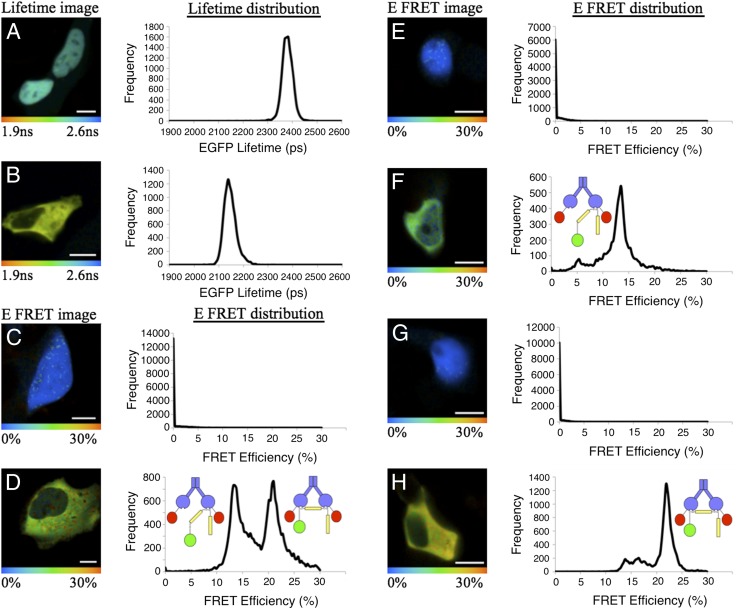
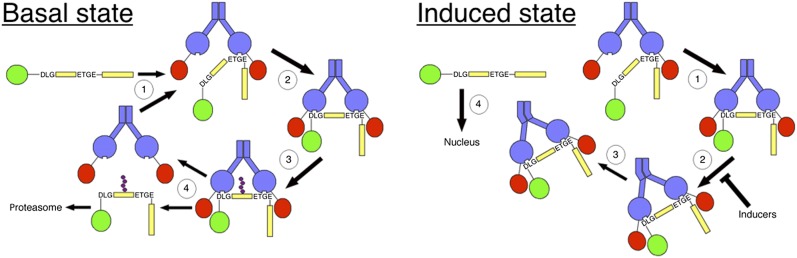
The transcription factor NF-E2 p45-related factor 2 (Nrf2), a master regulator of cytoprotective genes, is controlled by dimeric Kelch-like ECH associated protein 1 (Keap1), a substrate adaptor protein for Cullin3/RING-box protein 1 ubiquitin ligase, which normally targets Nrf2 for ubiquitination and degradation but loses this ability in response to electrophiles and oxidants (inducers). By using recombinant proteins and populations of cells, some of the general features of the regulation of Nrf2 by Keap1 have been outlined. However, how the two proteins interact at a single-cell level is presently unknown. We now report the development of a quantitative Förster resonance energy transfer-based system using multiphoton fluorescence lifetime imaging microscopy and its application for investigating the interaction between Nrf2 and Keap1 in single live cells. By using this approach, we found that under homeostatic conditions, the interaction between Keap1 and Nrf2 follows a cycle in which the complex sequentially adopts two distinct conformations: "open," in which Nrf2 interacts with a single molecule of Keap1, followed by "closed," in which Nrf2 binds to both members of the Keap1 dimer. Inducers disrupt this cycle by causing accumulation of the complex in the closed conformation without release of Nrf2. As a consequence, free Keap1 is not regenerated, and newly synthesized Nrf2 is stabilized. On the basis of these findings, we propose a model we have named the "cyclic sequential attachment and regeneration model of Keap1-mediated degradation of Nrf2." This previously unanticipated dynamism allows rapid transcriptional responses to environmental changes and can accommodate multiple modes of regulation.

Keywords: FLIM; FRET; protein–protein interactions; sulforaphane.


Conflict of interest statement

The authors declare no conflict of interest.

Figures

Fig. 1.
Fig. 1.
Cartoon representations and fluorescence lifetime data for Keap1-Nrf2 complexes. (A) Complex of wild-type Nrf2 with Keap1, in which Nrf2 is bound to Keap1 through both its high-affinity ETGE and low-affinity DLG motifs. (B) Complex of Nrf2ΔDLG mutant with Keap1, in which Nrf2 interacts with the Keap1 dimer only through the high-affinity ETGE motif. (C) Complex of Nrf2-doubleETGE mutant with Keap1, in which Nrf2 interacts with Keap1 through two high-affinity ETGE motifs. (D) Fluorescence lifetime data for cells transfected with EGFP-Nrf2 wild-type and mutant fusion proteins.
Fig. 2.
Fig. 2.
The Keap1-Nrf2 complex exists in two distinct conformations. HEK293 cells were transfected with wild-type EGFP-Nrf2 + mCherry (A and C), EGFP-Nrf2∆DLG + mCherry (E), EGFP-Nrf2-doubleETGE + mCherry (G), EGFP-Nrf2 + Keap1-mCherry (B and D), EGFP-Nrf2∆DLG + Keap1-mCherry (F), or EGFP-Nrf2-doubleETGE + Keap1-mCherry (H) and then imaged 24 h later. (Left) Pictorial representations of the EGFP lifetime (A and B) or the E-FRET (C–H), in which the color of the cell corresponds with the lifetime of EGFP, ranging from 1.9 to 2.6 ns, or to the E-FRET, ranging from 0% to 30%. (Right) Lifetime (A and B) or E-FRET (C–H) data from each pixel of the image, plotted on a graph. The lifetime of EGFP-Nrf2 in the presence of mCherry alone (A) is significantly longer than in the presence of Keap1-mCherry (B), indicating there is a FRET interaction between the two fusion proteins. This lifetime difference is seen in the images, in which A is blue and B is yellow. The E-FRET in wild-type or mutant EGFP-Nrf2 and mCherry cotransfected cells (C, E, and G) is 0, corresponding to the blue color of the cells. In EGFP-Nrf2 and Keap1-mCherry cotransfected cells (D), the E-FRET graph shows two distinct peaks (one centered at 13% and the other at 21%), suggesting there are two different FRET interactions between the EGFP and mCherry fluorophores within the Keap1-Nrf2 complex. These different E-FRET populations are shown pictorially (D, Left), where the green and yellow colors are distributed evenly across the cell. In EGFP-Nrf2∆DLG and Keap1-mCherry cotransfected cells (F), the E-FRET graph shows one peak at 13%, indicating there is a single FRET interaction between the EGFP and mCherry fluorophores within the Keap1-Nrf2∆DLG complex. This E-FRET population is shown pictorially in the image, in which the green color is distributed evenly across the cell. In EGFP-Nrf2-doubleETGE and Keap1-mCherry cotransfected cells (H), the E-FRET graph shows two peaks (a small one at 13% and a larger one at 21%), suggesting there is one major FRET interaction between the EGFP and mCherry fluorophores within the Keap1-Nrf2-doubleETGE complex. The distribution of the two E-FRET populations is shown pictorially in the image, in which the predominant color is yellow (corresponding to the 21% population), along with a small amount of green (corresponding to the 13% population). (Scale bar, 10 μm.)
Fig. 3.
Fig. 3.
E-FRET in EGFP-Nrf2–transfected cells imaged before and after treatment with inducers, a proteasomal inhibitor (MG132), and an inhibitor of the protein synthesis (cycloheximide; CHX). HEK293 cells were transfected with EGFP-Nrf2 + Keap1-mCherry, and the E-FRET was quantified for individual cells that were imaged twice: once in the basal state (A, C, E, and G) and once again after a 1-h treatment with 5 μM SFN (B), 10 μM STCA (D), or 10 μM MG132 (F) or after a 15-min treatment with 10 μM CHX (H). (Left) Pictorial representations in which the color of the cell corresponds with the E-FRET, ranging from 0% to 30%. (Right) E-FRET from each pixel of the image plotted on a graph. The graphs show that the E-FRET distribution is altered by both inducers, as well as by inhibition of the proteasome or the protein synthesis, whereby there is an increase in the interaction at 21% E-FRET. This can be also seen in the images in the left columns, in which there is an increase in the amount of yellow relative to green in response to all treatments. (Scale bar, 10 μm.)
Fig. 4.
Fig. 4.
The cyclic sequential attachment and regeneration model of Keap1-mediated degradation of Nrf2. In the basal state, newly translated Nrf2 (yellow) binds sequentially to a free Keap1 dimer (blue), first through the ETGE motif to form the open conformation (1) and then through the DLG motif, to form the closed conformation (2). Once in the closed conformation, Nrf2 can be targeted for ubiquitination by the Keap1-dependent E3-ubiquitin ligase (3). Ubiquitinated Nrf2 is released from Keap1 and degraded by the proteasome. The free Keap1 dimer is regenerated and able to bind to newly translated Nrf2 (4), and the cycle begins again. In the induced state, the formation of the closed conformation is uncoupled from ubiquitination (2). As a consequence, Nrf2 is not released from Keap1 (3), free Keap1 is not regenerated, and newly translated Nrf2 accumulates and turns on the expression of cytoprotective genes (4).

References

    1. Malhotra D, et al. Global mapping of binding sites for Nrf2 identifies novel targets in cell survival response through ChIP-Seq profiling and network analysis. Nucleic Acids Res. 2010;38(17):5718–5734. - PMC - PubMed
    1. Kobayashi A, et al. Oxidative stress sensor Keap1 functions as an adaptor for Cul3-based E3 ligase to regulate proteasomal degradation of Nrf2. Mol Cell Biol. 2004;24(16):7130–7139. - PMC - PubMed
    1. Zhang DD, Lo SC, Cross JV, Templeton DJ, Hannink M. Keap1 is a redox-regulated substrate adaptor protein for a Cul3-dependent ubiquitin ligase complex. Mol Cell Biol. 2004;24(24):10941–10953. - PMC - PubMed
    1. Furukawa M, Xiong Y. BTB protein Keap1 targets antioxidant transcription factor Nrf2 for ubiquitination by the Cullin 3-Roc1 ligase. Mol Cell Biol. 2005;25(1):162–171. - PMC - PubMed
    1. Dinkova-Kostova AT, et al. Direct evidence that sulfhydryl groups of Keap1 are the sensors regulating induction of phase 2 enzymes that protect against carcinogens and oxidants. Proc Natl Acad Sci USA. 2002;99(18):11908–11913. - PMC - PubMed

Publication types

MeSH terms

Substances