. 2013 Jan;23(1):46-63.
doi: 10.4103/0971-3026.113615.

Tuberculosis of the genitourinary system-Urinary tract tuberculosis: Renal tuberculosis-Part I

Affiliations

Tuberculosis of the genitourinary system-Urinary tract tuberculosis: Renal tuberculosis-Part I

Suleman Merchant et al. Indian J Radiol Imaging. 2013 Jan.

Abstract

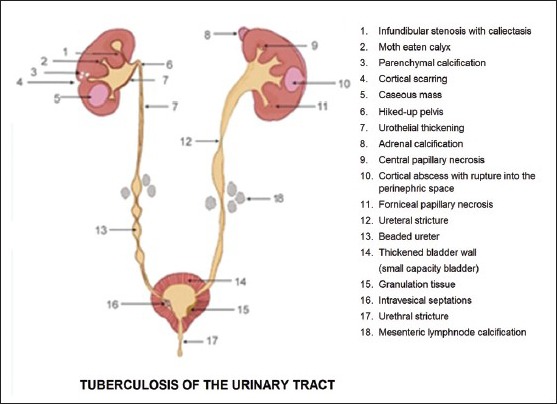
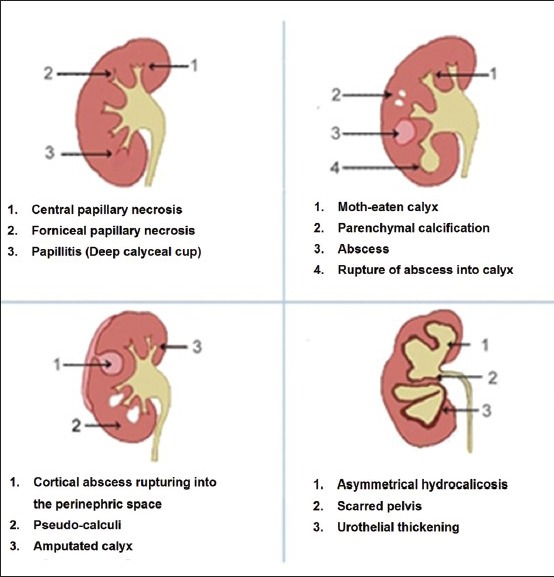
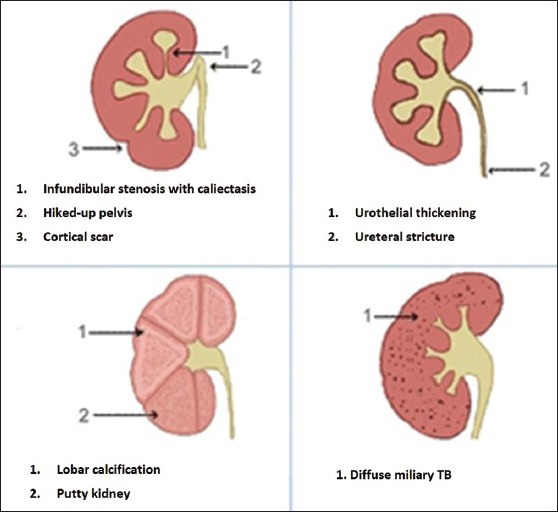
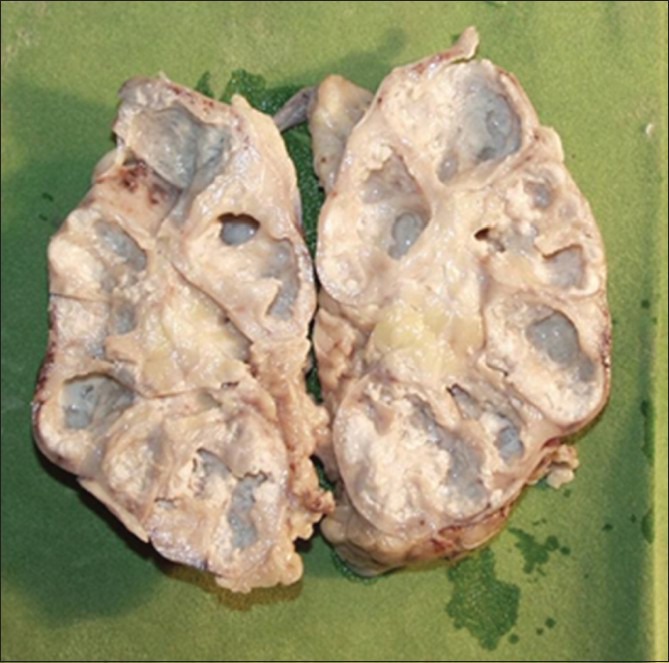
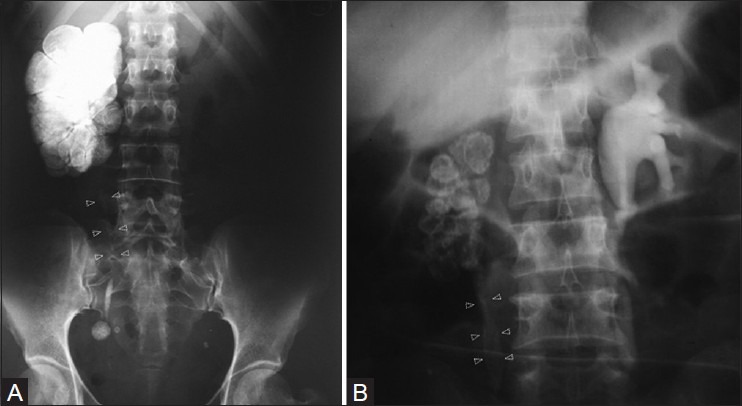
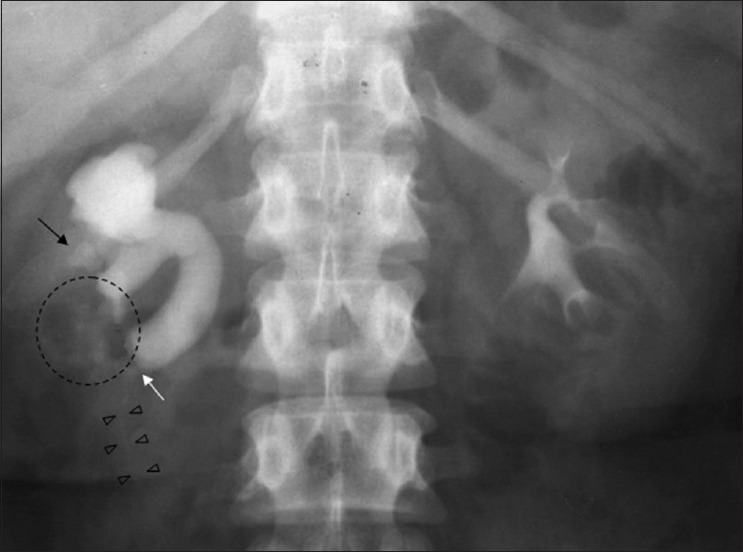
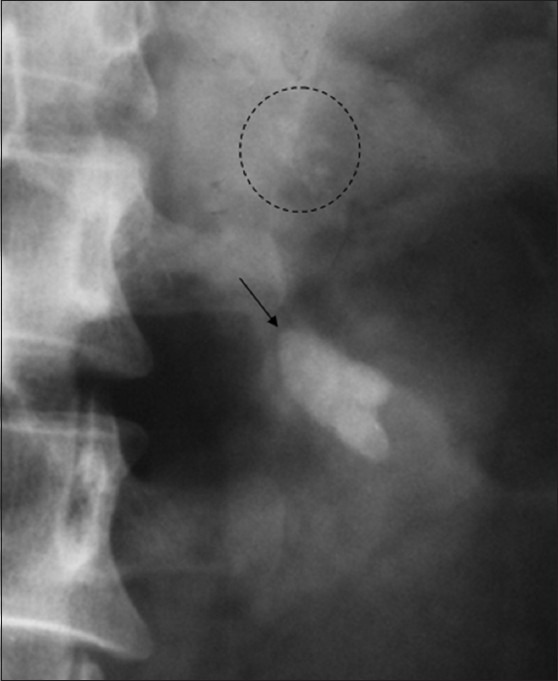
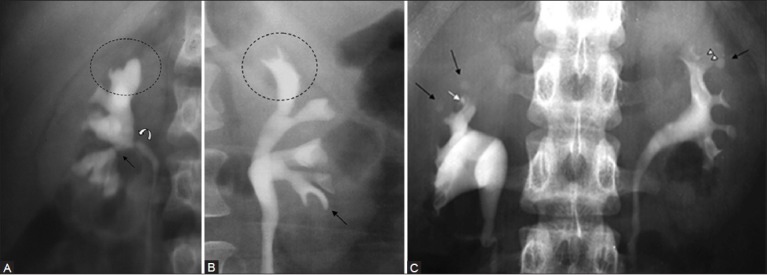
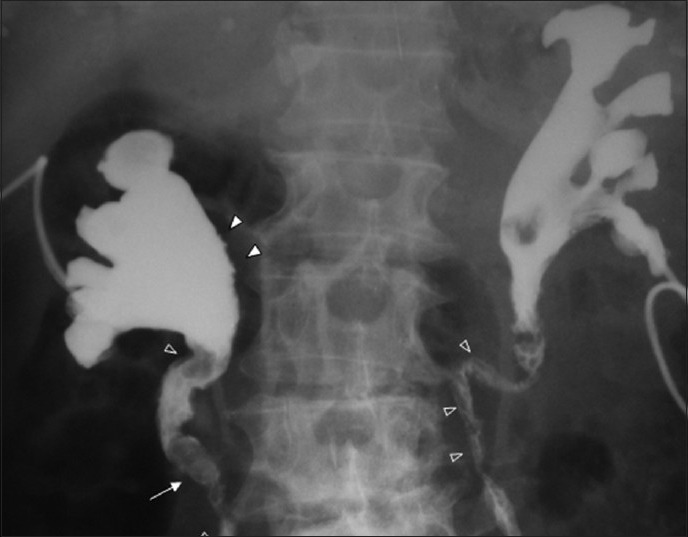
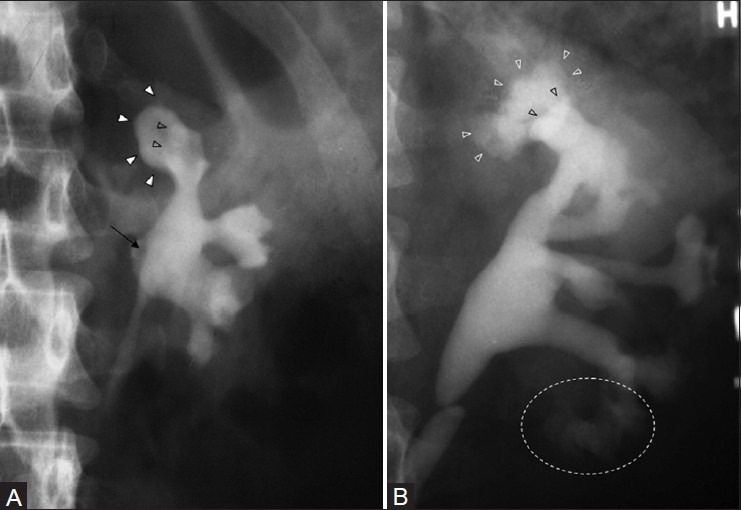
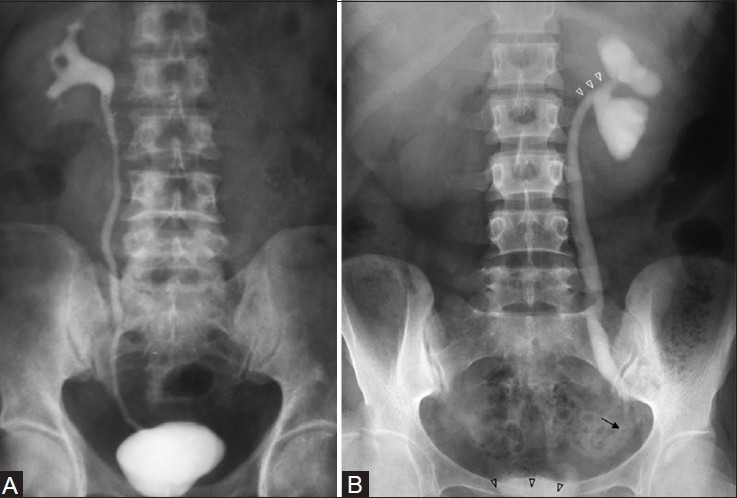
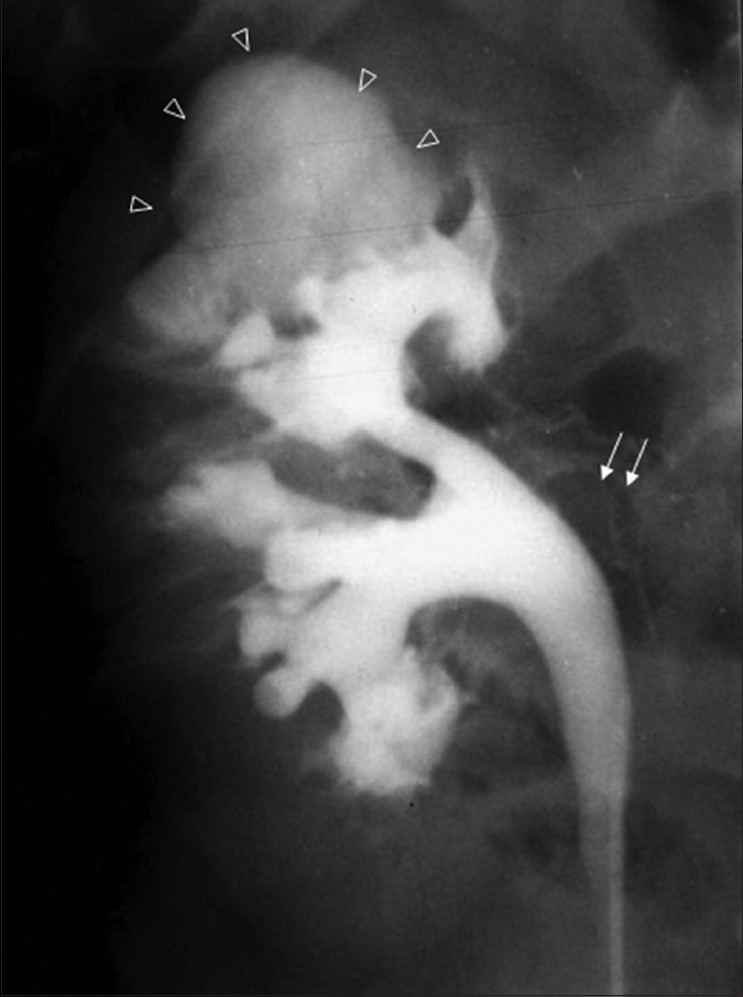
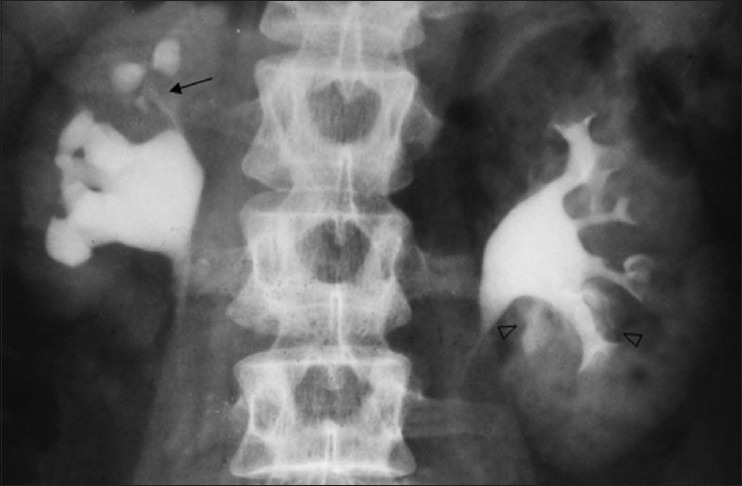
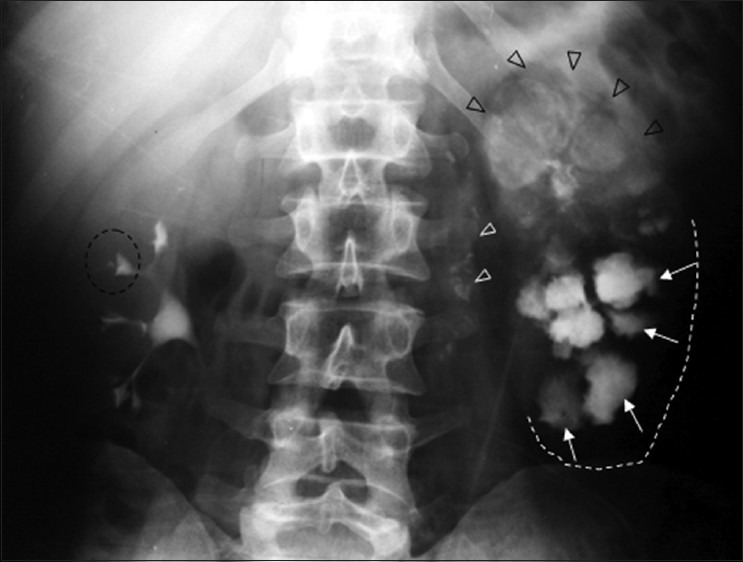
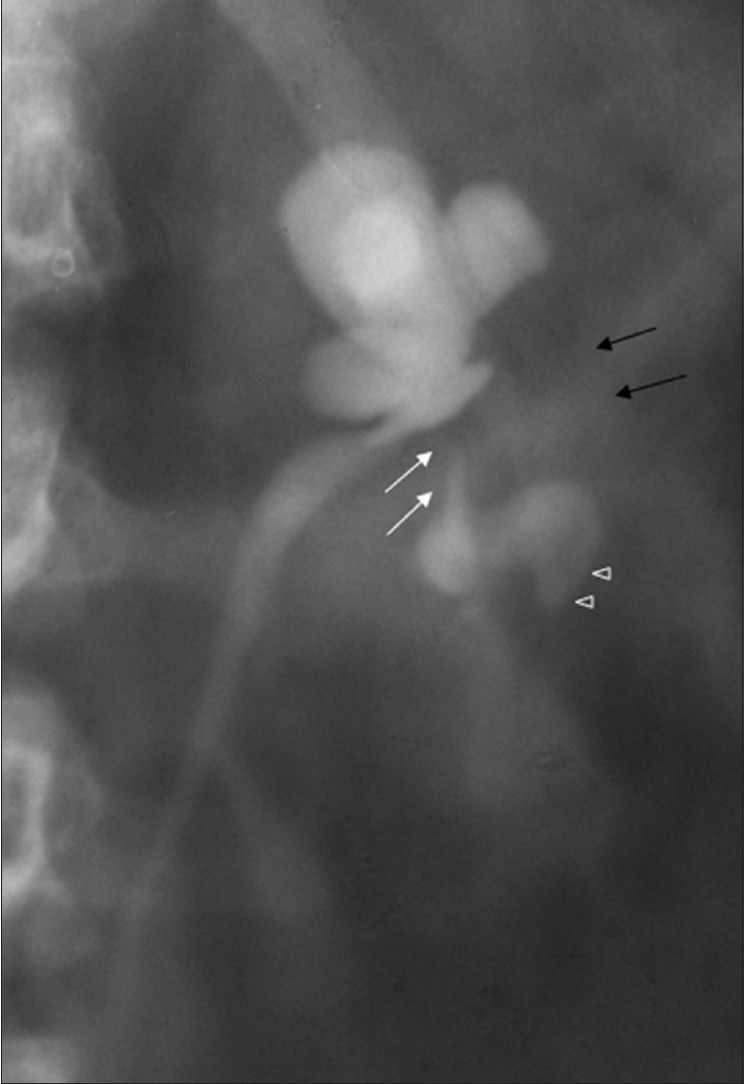
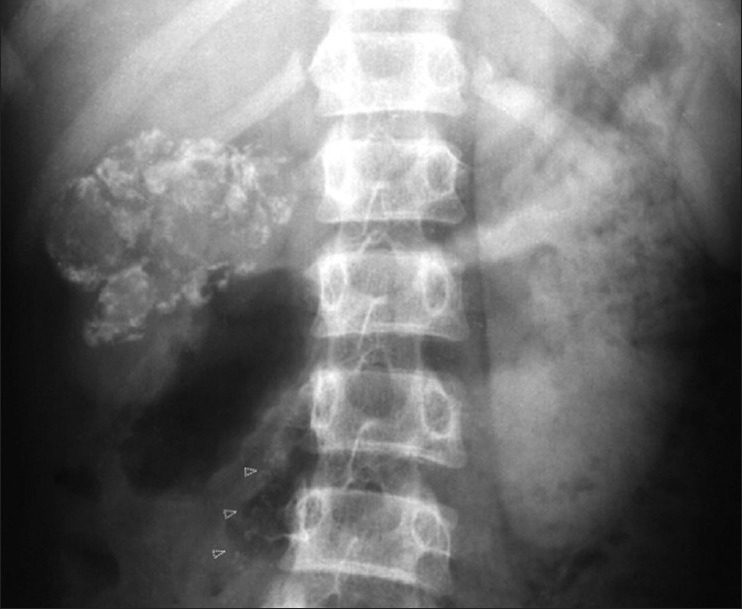
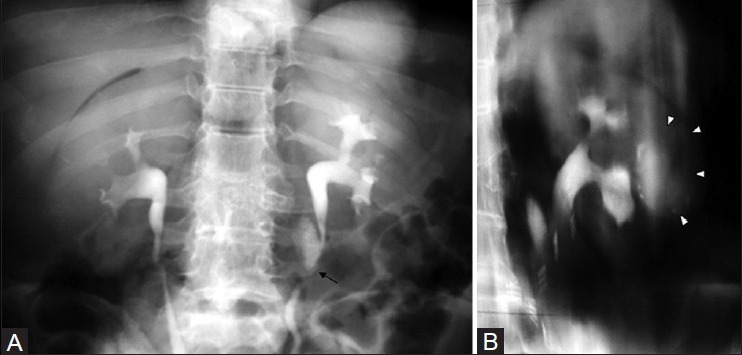
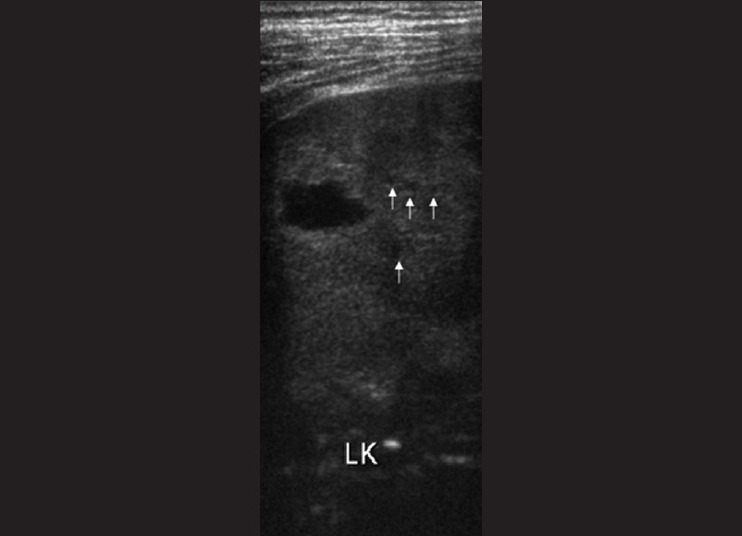
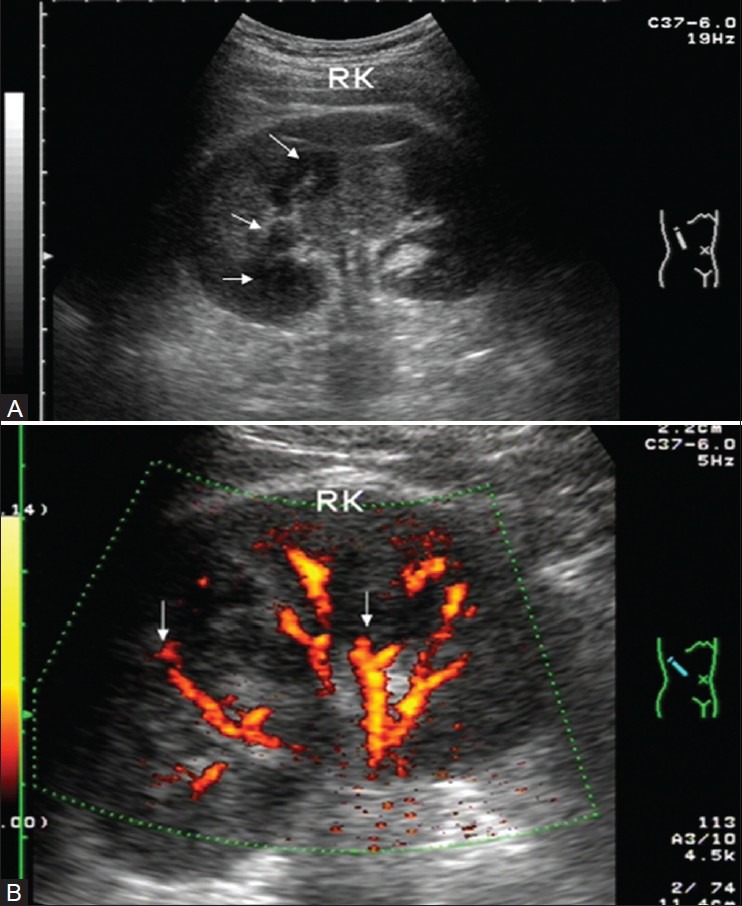
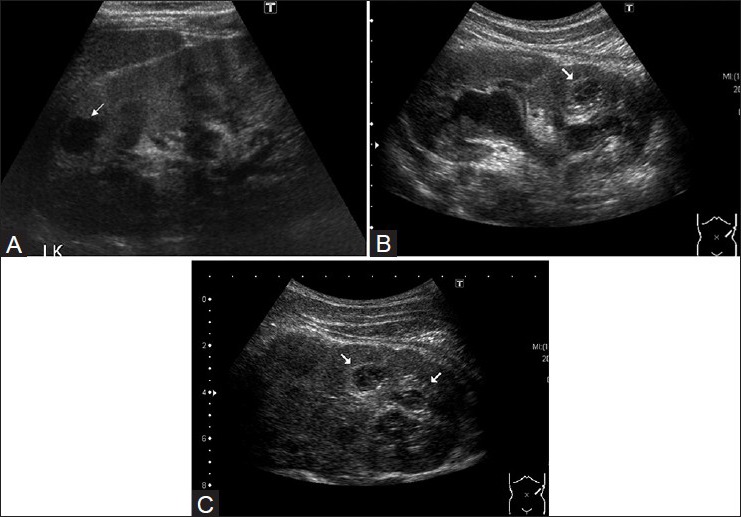
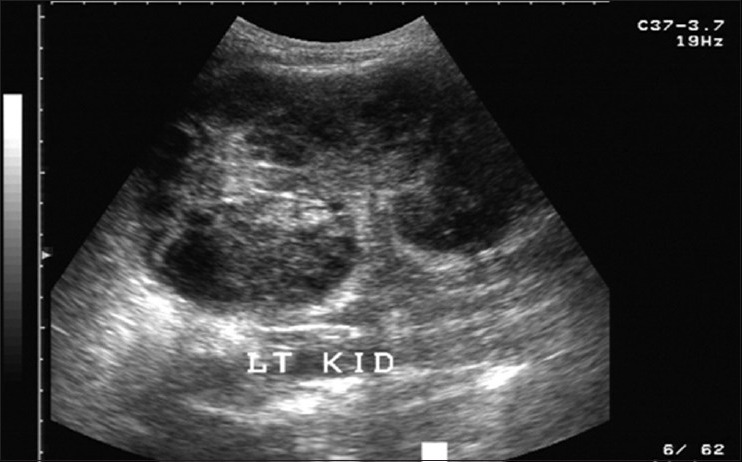
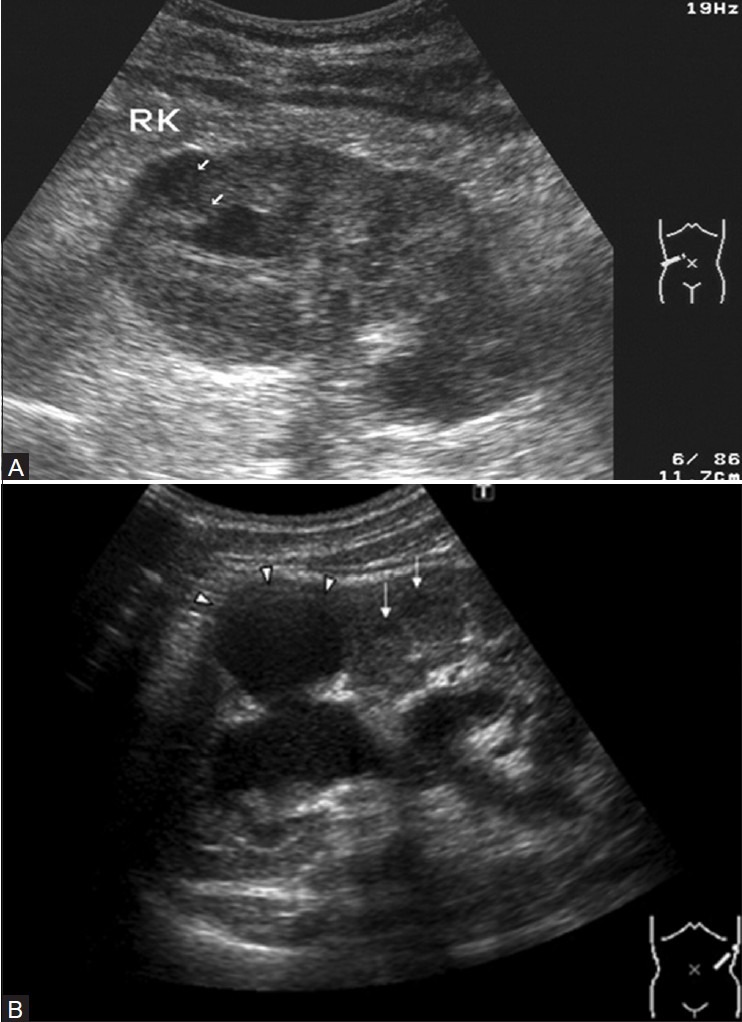
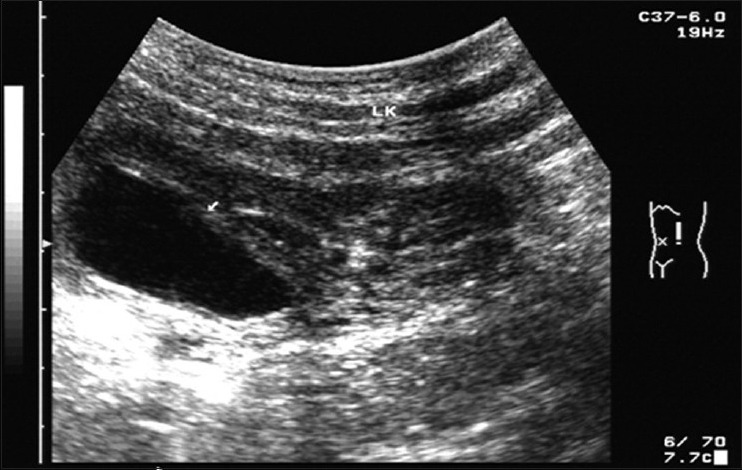
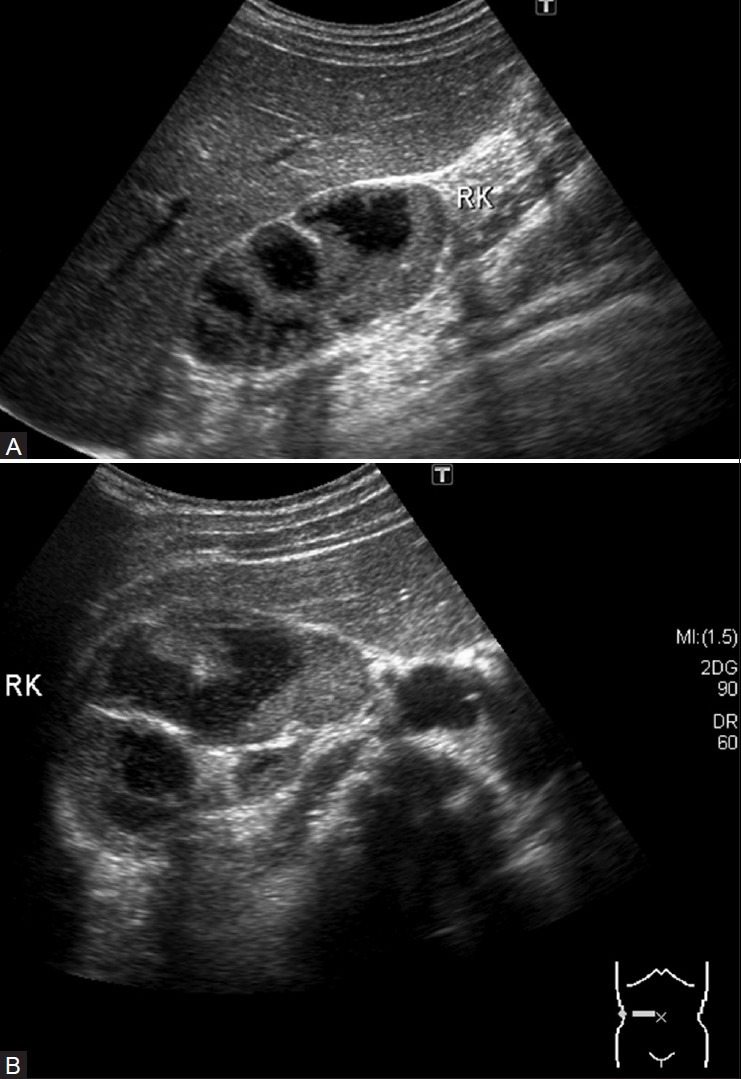
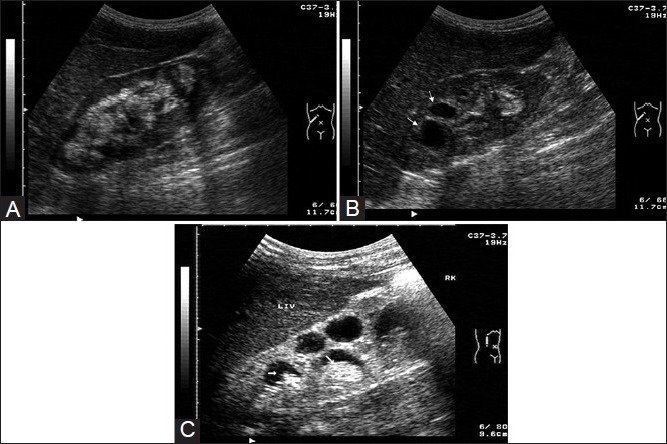
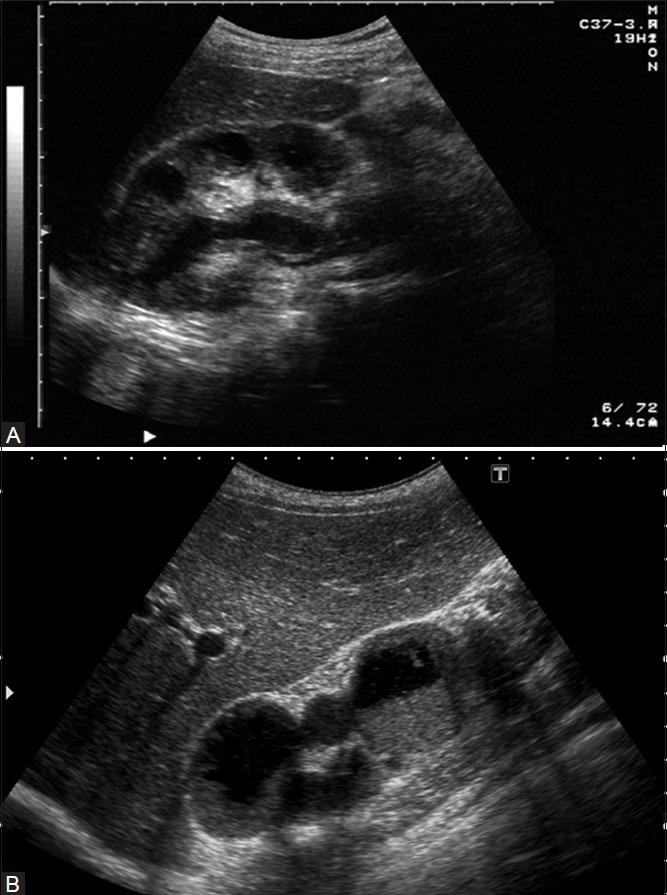
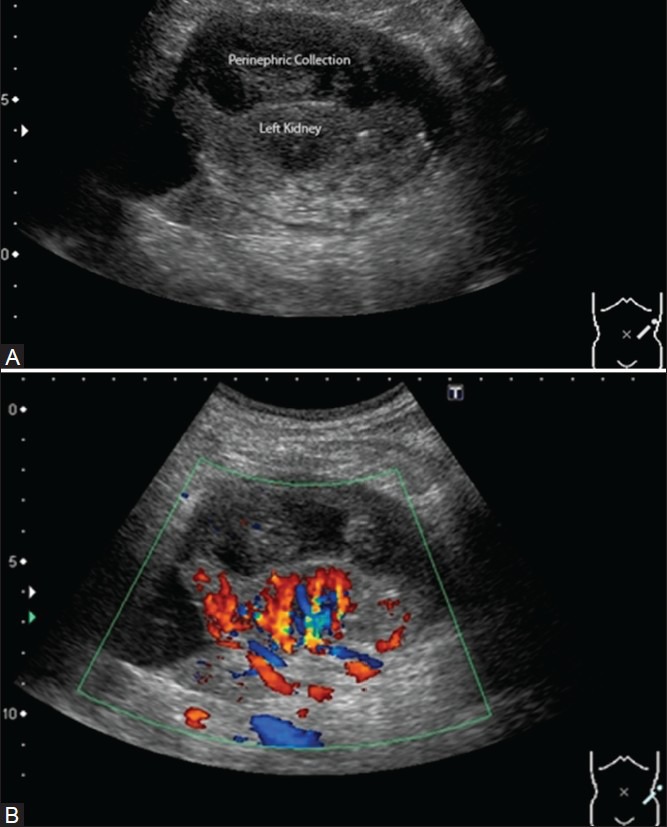
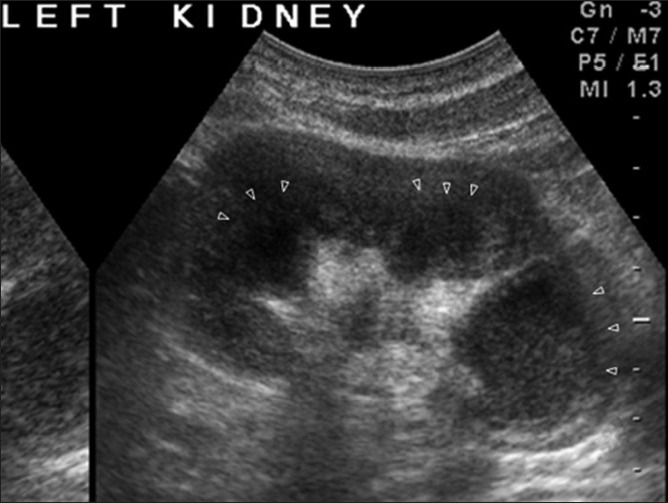
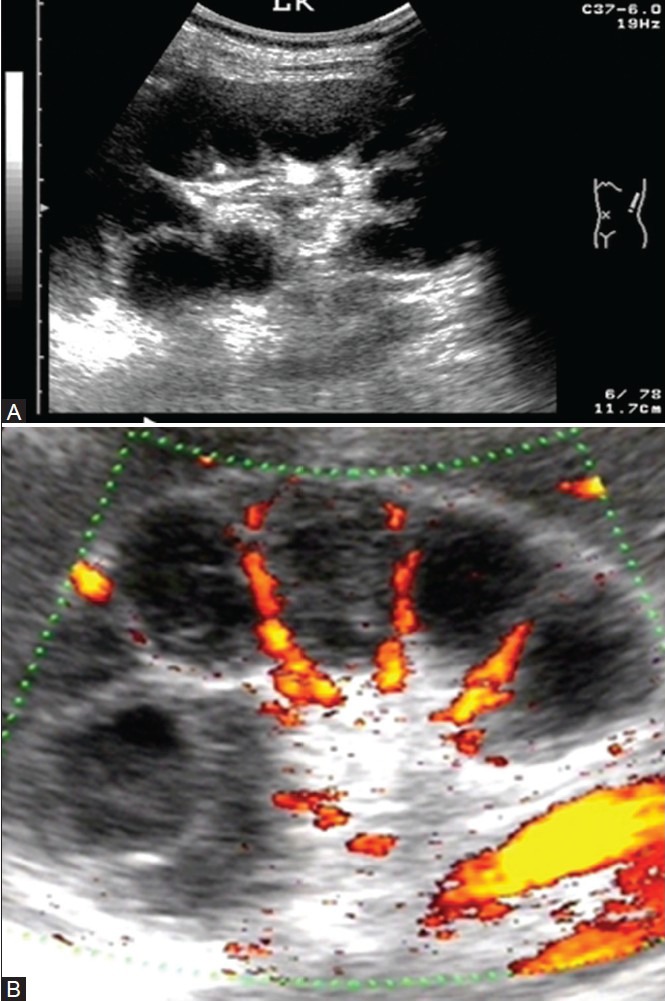
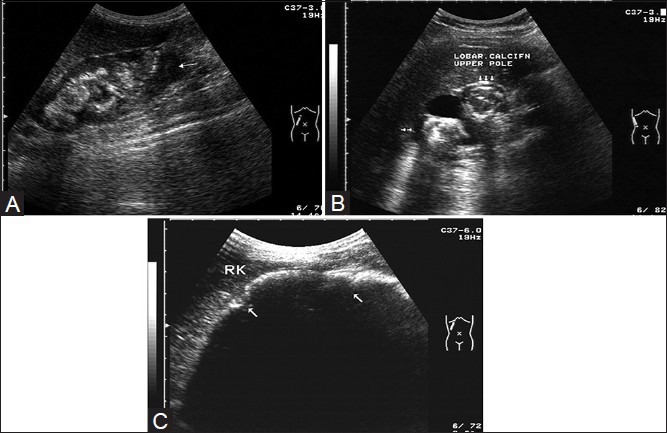
Tuberculosis (TB) remains a worldwide scourge and its incidence appears to be increasing due to various factors, such as the spread of human immunodeficiency virus (HIV) and acquired immunodeficiency syndrome (AIDS). The insidious onset and non-specific constitutional symptoms of genitourinary tuberculosis (GUTB) often lead to delayed diagnosis and rapid progression to a non-functioning kidney. Due to hematogenous dissemination of TB, there is a potential risk of involvement of the contralateral kidney too. Imaging plays an important role in the making of a timely diagnosis and in the planning of treatment, and thus helps to avoid complications such as renal failure. Imaging of GUTB still remains a challenge, mainly on account of the dearth of literature, especially related to the use of the newer modalities such as magnetic resonance imaging (MRI). This two-part article is a comprehensive review of the epidemiology, pathophysiology, and imaging findings in renal TB. Various imaging features of GUTB are outlined, from the pathognomonic lobar calcification on plain film, to finer early changes such as loss of calyceal sharpness and papillary necrosis on intravenous urography (IVU); to uneven caliectasis and urothelial thickening, in the absence of renal pelvic dilatation, as well as the hitherto unreported 'lobar caseation' on ultrasonography (USG). Well-known complications of GUTB such as sinus tracts, fistulae and amyloidosis are described, along with the relatively less well-known complications such as tuberculous interstitial nephritis (TIN), which may remain hidden because of its 'culture negative' nature and thus lead to renal failure. The second part of the article reviews the computed tomography (CT) and MRI features of GUTB and touches upon future imaging techniques along with imaging of TB in transplant recipients and in immunocompromised patients.

Keywords: Renal tuberculosis; intravenous urography; lobar caseation; tuberculous interstitial nephritis; ultrasonography; uneven caliectasis.


Conflict of interest statement

Conflict of Interest: None declared.

Figures

Figure 1A
Figure 1A
Diagrammatic representation of the varied effects of tuberculosis on the urinary tract
Figure 1B
Figure 1B
Diagrammatic representation demonstrating the pathological changes of renal tuberculosis
Figure 1C
Figure 1C
Diagrammatic representation demonstrating the pathological changes of renal tuberculosis
Figure 2
Figure 2
Pathology specimen of end-stage renal tuberculosis: The basis for the ‘lobar caseation pattern’ is evident
Figure 3 (A, B)
Figure 3 (A, B)
(A) Plain radiograph revealing classic lobar pattern of calcification, which is pathognomonic of end-stage renal tuberculosis. Ureteral calcification is also noted, which is fainter in upper parts (arrowheads), (B) intravenous urogram revealing the ‘classic’ lobar pattern of calcification in a non-functioning (R) kidney. (The lobar distribution of calcification is better appreciated in the upper half of the kidney). Ureteral calcification is also noted (arrowheads)
Figure 4
Figure 4
Intravenous urogram revealing a (R) ureteric stricture (white arrow) with ureteric calcification (black arrowheads), pseudo-calculi (black arrow), and irregular calcification in the parenchyma (circled area)
Figure 5
Figure 5
Intravenous urogram revealing an upward pointing (arrow) renal pelvic calculus, suggesting the presence of a hiked up renal pelvis. Multiple discrete calcifications are noted in an upper polar tuberculosis cavity (circled area)
Figure 6 (A-C)
Figure 6 (A-C)
(A) Intravenous urogram revealing lower infundibular (arrow) and renal pelvic scarring (curved arrow). Note areas of papillary necrosis in the circled area, (B) Intravenous urogram revealing papillary necrosis in the upper group of calyces, with irregularity of the calyceal margins and the lateral margin of the upper infundibulum (dotted circle), indicating spread of infection from the calyx to the infundibulum. (Healing forniceal papillary necrosis of non-tuberculosis origin noted in a lower calyx (arrow), (C) Intravenous urogram revealing multiple parenchymal cavities (black arrows) with areas of papillary necrosis (white arrow) in the upper group calyces, bilaterally. The (L) upper group (lateral division) calyceal outline is destroyed by adjacent granulomatous tissue (arrowheads)
Figure 7
Figure 7
Bilateral percutaneous nephrostomogram revealing multiple filling defects along the upper ureter, bilaterally, representing sumucosal granulomas (empty arrowheads). The large filling defect noted in the (R) ureter is a calculus (white arrow). The high density of the contrast in the collecting systems is obscuring the sumucosal granulomas; however, irregularity along the medial pelvic margin gives a clue to the presence of the same (solid arrowheads)
Figure 8 (A, B)
Figure 8 (A, B)
(A) Intravenous urogram revealing a “hiked up” renal pelvis (arrow). Tuberculosis cavity (white arrowheads) communicating with the upper group of calyces. Black arrowheads represent medial border of a compound upper calyx, (B) Intravenous urogram revealing fluffy cavities (white arrowheads) communicating with a compound upper calyx (black arrowheads). Odd-shaped pockets of contrast communicating with a lower calyx (and with each other) [circled area], represent caseated necrotic cavities
Figure 9 (A, B)
Figure 9 (A, B)
(A) Intravenous urogram revealing a non-functioning (L) kidney and a small capacity urinary bladder. The combination is suggestive of a tuberculosis origin for the non-function, (B) Intravenous urogram revealing non-functioning (R) kidney. (L) Renal pelvic and upper infundibular scarring (white arrowheads), resulting in uneven caliectasis. A (L) lower ureteric stricture (arrow) and small capacity bladder (black arrowheads) are also noted
Figure 10
Figure 10
Pyelocavitatory (arrowheads) and pyelolymphatic reflux (arrows) noted on retrograde pyelography
Figure 11
Figure 11
Intravenous urogram revealing right upper infundibular (arrow) and calyceal strictures, with cortical scarring. Pyelosinus extravasation of contrast in the (L) kidney (arrowheads) suggests the presence of fragile calyces
Figure 12
Figure 12
Delayed phase of intravenous urogram with a non-functional (L) kidney opacified retrogradely: Developing lobar caseation in the U/3 of the (L) kidney (black arrowheads). Note assimilation of the dilated calyces into the renal parenchyma. Ragged hydrocalicosis(indicative of marked urothelial thickening) noted in the lower half of the (L) kidney (arrows). Parenchymal demarcation is still clear adjacent to the same (dotted line represents the non-visualized left renal outline). (R) renal papillary necrosis is also seen (circled area) and so are calcified (L) paraspinal lymph nodes (white arrowheads)
Figure 13
Figure 13
Intravenous urogram revealing cicatrization that has resulted in obliteration of the renal pelvis, multiple infundibular strictures (white arrows) and uneven caliectasis. Note non-visualization of the middle group of calyces–the “phantom calyx” (black arrows) and a cavity communicating with a lower calyx (arrowheads)
Figure 14
Figure 14
Nephrographic phase of intravenous urogram: (R) subtotal autonephrectomy (“lobar calcification”) with partial sparing of the lower pole, which revealed functional calyces on later films. Note scattered calcification in the right psoas region (arrowheads)
Figure 15 (A, B)
Figure 15 (A, B)
(A) Intravenous urogram revealing calcified (L) psoas abscess (black arrow), impinging on the ureter and a calcified caseous renal mass (arrowheads); more apparent on nephrotomography (B)
Figure 16
Figure 16
USG - multiple tiny granulomas (white arrows) noted around a caseated tuberculosis cavity in the left kidney, on this high-resolution (7.5 MHz) ultrasound image
Figure 17 (A, B)
Figure 17 (A, B)
(A) USG revealing tuberculosis granulomas of varying sizes (white arrows), (B) USG revealing larger granulomas–the granulomas are highlighted by the vascular “cut-off” (white arrows) noted on this color flow image
Figure 18 (A-C)
Figure 18 (A-C)
(A) High-resolution ultrasound images (acquired with a 7.5 MHz transducer) demonstrate a small irregular caseous cavity (white arrow) in the upper part of the left renal parenchyma, (B) high-resolution ultrasound images revealing a tuberculous cavity with fine septae within, in the lower part of the left kidney of another patient. Note marked urothelial thickening in this dilated system, (C) USG image revealing irregular sonolucent cavities, with a semisolid echo texture
Figure 19
Figure 19
USG image revealing an xanthogranulomatous pyelonephritis-like appearance in an enlarged tuberculous kidney
Figure 20 (A, B)
Figure 20 (A, B)
(A) USG image revealing a caseating tuberculous granuloma, communicating with a calyx via a narrow tract (white arrows), (B) USG image revealing a large thick walled caseated tuberculous cavity communicating with the upper calyx (arrowheads). Small granulomas are noted inferior to this cavity (arrows)
Figure 21
Figure 21
USG image revealing severe focal caliectasis, with moderate urothelial thickening in the upper calyx (white arrow)
Figure 22 (A, B)
Figure 22 (A, B)
(A) USG image revealing uneven caliectasis with ragged urothelial thickening in a tuberculous kidney- longitudinal scan, (B) USG image revealing uneven caliectasis with ragged urothelial thickening in a tuberculous kidney. transverse scan
Figure 23 (A-C)
Figure 23 (A-C)
(A) USG image revealing hyperechogenic areas of caseation interspersed with the echogenic sinus echoes. (coronal scan), (B) Oblique USG scan reveals uneven caliectasis (white arrows) with a hazy interface and urothelial thickening in the upper calyces. The lower calyceal region is replaced by hyperechogenic caseous tissue, (C) Comparative USG image of regular (evenly dilated) caliectasis with hyperechoic fungal balls (white arrows) in a HIV-positive patient (note the hyperechogenic material is lying within clearly dilated calyces and are not replacing them as happens in tuberculous caseation)
Figure 24
Figure 24
(A) Moderate-to-severe urothelial thickening noted throughout the visualized urothelium. This is well visualized on account of the dilatation due to a tuberculous ureteric stricture, (B) USG image revealing uneven caliectasis with ragged urothelial thickening (arrowheads). Note significant debris in the lower calyces
Figure 25
Figure 25
(A) USG image revealing left tuberculous perinephric collection due to a ruptured upper polar tuberculous abscess. (A) Grey scale image, (B) USG image revealing left tuberculosis perinephric collection due to a ruptured upper polar tuberculous abscess. Color flow image revealing lateral extent of the renal parenchyma
Figure 26
Figure 26
USG image showing evolution of tuberculous lobar caseation. Different phases of destruction are apparent. (Lower group calyces are completely merged with the parenchyma, midgroup calyces about to merge, and upper ones almost merged). Arrowheads demarcate the junction between residual parenchyma and the dilated calyces
Figure 27
Figure 27
(A) USG image revealing lobar caseation (A) Grey scale and, (B) Color flow image demonstrating presence of renal vasculature only between the caseated lobes
Figure 28
Figure 28
(A) USG image revealing caseation with a developing lobar pattern of calcification, in almost all calyces, barring the lower group of calyces (white arrow) (B) USG image revealing classic “lobar calcification”- pathognomonic of renal tuberculous (C) USG image revealing a densely calcified kidney producing acoustic shadowing that obscures underlying details. White arrows point to junctions between the renal lobes

References

    1. Muttarak M, Chiang Mai WN, Lojanapiwat B. Tuberculosis of the genitourinary tract: Imaging features with pathological correlation. Singapore Med J. 2005;46:568–74. - PubMed
    1. Global tuberculosis control: Key findings from the December 2009 WHO report. Wkly Epidemiol Rec. 2010;85:69–80. - PubMed
    1. Chauhan LS, Tonsing J. Revised national TB control programme in India. Tuberculosis (Edinb) 2005;85:271–6. - PubMed
    1. Burrill J, Williams CJ, Bain G, Conder G, Hine AL, Misra RR. Tuberculosis: A radiologic review. Radiographics. 2007;27:1255–73. - PubMed
    1. Craig WD, Wagner BJ, Travis MD. Pyelonephritis: Radiologic-pathologic review. Radiographics. 2008;28:255–77. - PubMed