

Wait time as a driver of overall patient satisfaction in an ophthalmology clinic
- PMID: 23986630
- PMCID: PMC3754818
- DOI: 10.2147/OPTH.S49382
Wait time as a driver of overall patient satisfaction in an ophthalmology clinic
Abstract
Purpose: The purpose of this study was to determine whether the actual time patients spend waiting is correlated with overall patient satisfaction scores.
Methods: This was a cross-sectional survey study conducted in an outpatient ophthalmology clinic. The actual time each patient waited to be called by the provider was recorded, and a survey was given at the end of the visit.
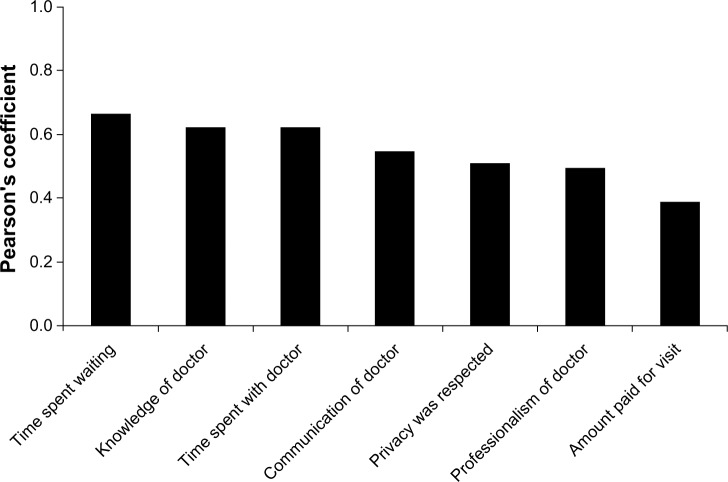
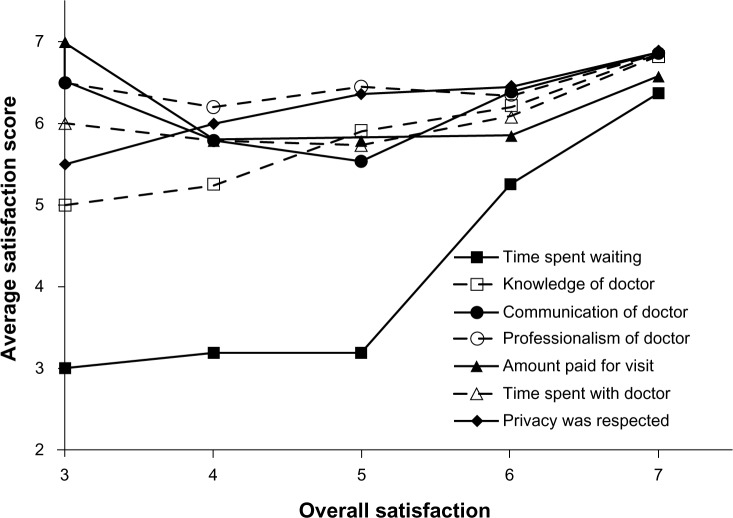
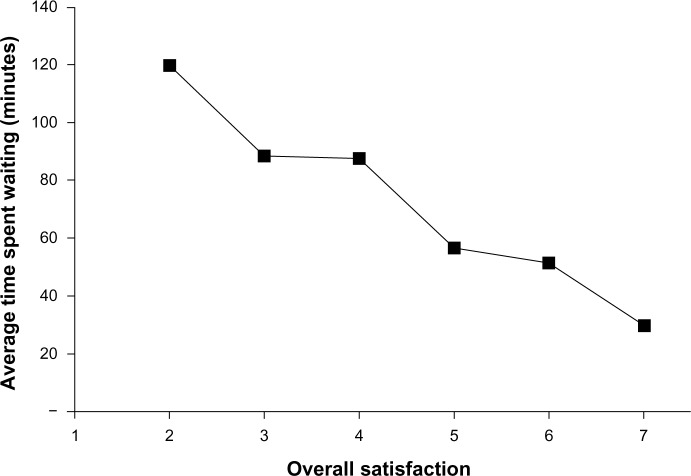
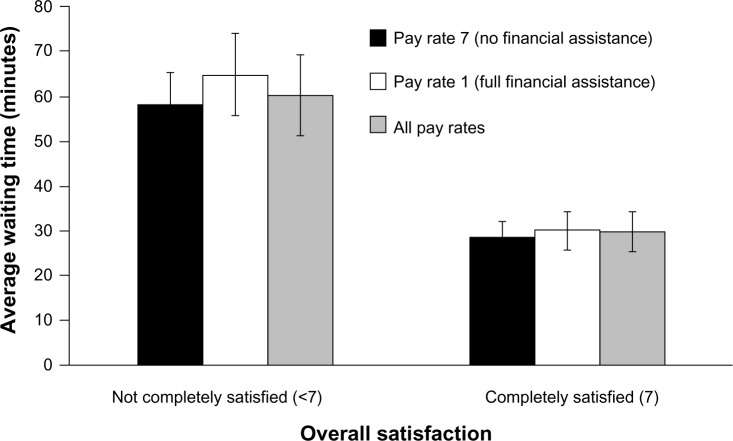
Results: There was a significant correlation between the time patients spent waiting and overall patient satisfaction scores (P < 0.001). Patients who were not completely satisfied waited twice as long as those who were completely satisfied (P < 0.001), regardless of whether patients received free care. Satisfaction with the amount of time spent waiting was the strongest driver of overall satisfaction score.
Conclusion: Minimizing the time patients spend waiting to see a provider can result in higher overall patient satisfaction scores, regardless of financial status.
Keywords: ambulatory care; patient satisfaction; quality of care; wait time.
Figures
References
-
- Billing K, Newland H, Selva D. Improving patient satisfaction through information provision. Clin Experiment Ophthalmol. 2007;35(5):439–447. - PubMed
-
- Lean-driven improvements slash wait times, drive up patient satisfaction scores. ED Manag. 2012;24(7):79–81. [No authors listed] - PubMed
-
- Zopf D, Joseph AW, Thorne MC. Patient and family satisfaction in a pediatric otolaryngology clinic. Int J Ped Otorhinolaryngol. 2012;76(9):1339–1342. - PubMed
-
- Trentman TL, Cornidez EG, Wilshusen LL, et al. Patient satisfaction in an academic chronic pain clinic. Pain Pract. 2012;13(5):372–379. - PubMed
LinkOut - more resources
Full Text Sources
Other Literature Sources
Medical
