

doi: 10.3389/fncel.2013.00133.
eCollection 2013.
Variability in micro RNA (miRNA) abundance, speciation and complexity amongst different human populations and potential relevance to Alzheimer's disease (AD)
Affiliations
- PMID: 23986657
- PMCID: PMC3753559
- DOI: 10.3389/fncel.2013.00133
Item in Clipboard
Variability in micro RNA (miRNA) abundance, speciation and complexity amongst different human populations and potential relevance to Alzheimer's disease (AD)
Front Cell Neurosci.
.
No abstract available
Keywords: Alzheimer's disease; african american; caucasian american; human biochemical individuality; human populations; miRNA profiling; miRNA speciation; superior temporal lobe neocortex.
Figures
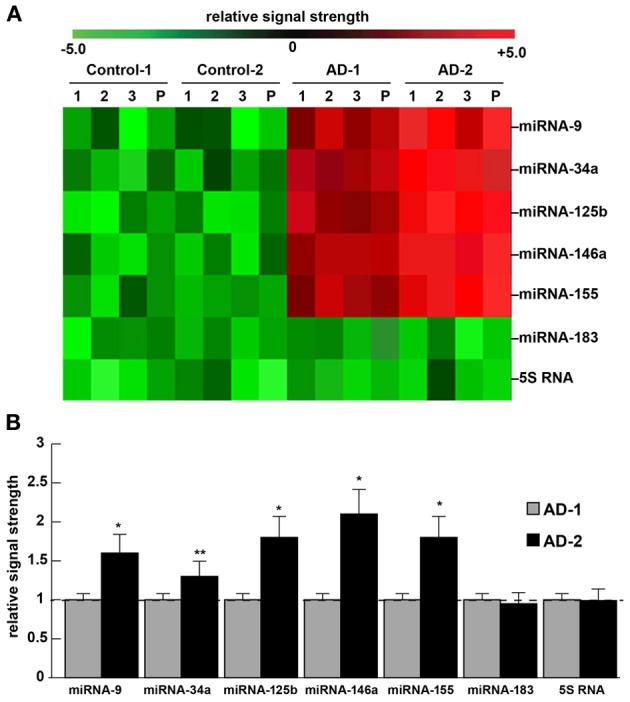
Incidence of miRNA abundance, speciation and complexity for 5 NF-kB-sensitive pro-inflammatory miRNAs in the superior temporal lobe (Brodmann Area A22) of 2 different human populations: The current explosion in miRNA profiling of human disease, including neuro-degenerative diseases such as Alzheimer's disease (AD), underscores “human genetic individuality.” Preliminary data suggests that there is considerable variation in miRNA abundance, speciation and complexity in human populations, and variation in miRNA abundance amongst individuals or populations may be a reflection of their individual genetic-based susceptibility to disease incidence or severity. (A) depicts a representative color-coded cluster diagram for 2 control and 2 selected “AD” populations; control-1 miRNA signals are derived from Caucasian Americans [age mean ± 1 standard deviation (SD) = 75.5 ± 8.4 year] and control-2 miRNA signals (age mean ± 1 SD = 76.1 ± 7.8 year) are derived from African Americans; similarly AD-1 miRNA signals are derived from Caucasian Americans [age mean ± 1 SD = 77.4 ± 7.5 year] with AD, and AD-2 miRNA signals are derived from African Americans (age mean ± 1 SD = 76.6 ± 8.2 year) with AD; all AD cases were for moderate-to-advanced stages of AD. Because, as single stranded ribonucleotides, miRNAs appear to have a relatively short half-life, all PMIs had a mean of 2.1 h or less (Sethi and Lukiw, ; Cui et al., 2010); there were no significant differences in age, PMI, ApoE allele status, RNA quality (all RIN values were 8.1–9.0) or yield between the control or AD groups (p > 0.05, ANOVA), or between the Caucasian and African American groups; note the higher general expression for miRNA-9, miRNA-34a, miRNA-125b, miRNA-146a and miRNA-155 (a) for all AD cases over controls and (b) for AD-2 versus AD-1; miRNAs in all AD cases were compared to 2 unchanging internal controls miRNA-183 and 5S RNA in the same brain sample; the numbers “1,” “2” and “3” are from individual control or AD cases; the letter “P” (also analyzed in B); using miRNA arrays, in Caucasian Americans miRNA-9, miRNA-34a, miRNA-125b, miRNA-146a and miRNA-155 were found to be up-regulated an average of 1.5-to-3.5 fold over age-matched controls, in African Americans this same group of miRNAs averaged an up-regulation of 3-to-5-fold over age-matched controls. (B) (bar graph) depicts quantitative results using RT-PCR, comparing AD-1 miRNA abundance [AD, (N = 8) relative to control miRNA (N = 8) signals; Caucasian Americans, set to 1.0 (for ease of comparison; dashed horizontal line)] to AD-2 miRNA abundance [AD (N = 8) relative to control miRNA (N = 8) signals; African Americans]; the data is suggestive of significantly higher miRNA abundance for these 5 potentially pathogenic miRNAs in the AD-2 group which may, in part, form a molecular-genetic basis for the predisposition of African Americans, and perhaps other ethnic groups, to different incidences of AD-type neuropathology, including variations in dementia development, severity, age of onset, progression, course and epidemiology (Espino and Lewis, ; Tang et al., ; Shadlen et al., ; Cui et al., ; Venketasubramanian et al., ; Reitz et al., ; this paper); *p < 0.01; **p < 0.05 (ANOVA). As further discussed in the text, selective differences in miRNA abundance may be useful in AD diagnosis and individualistic therapeutic strategies, to tailor more effective clinical treatment for AD and other progressive, age-related neurological disorders of the human CNS.
References
-
- Alzheimer Association. (2013). Alzheimer's Disease Facts and Figures Statistical Resource. Available online at: http://www.alz.org/downloads/Facts_Figures_2013.pdf
-
- Colangelo V., Schurr J., Ball M. J., Pelaez R. P., Lukiw W. J. (2002). Gene expression profiling of 12633 genes in Alzheimer hippocampal CA1: transcription and neurotrophic factor down-regulation and up-regulation of apoptotic and pro-inflammatory signaling. J. Neurosci. Res. 70, 462–473 10.1002/jnr.10351 - DOI - PubMed
Grants and funding
LinkOut - more resources
Full Text Sources
Other Literature Sources