. 2013 Aug 22:7:16.
doi: 10.3389/fninf.2013.00016. eCollection 2013.

Impact of functional MRI data preprocessing pipeline on default-mode network detectability in patients with disorders of consciousness

Affiliations

Impact of functional MRI data preprocessing pipeline on default-mode network detectability in patients with disorders of consciousness

Adrian Andronache et al. Front Neuroinform. .

Erratum in

  • Front Neuroinform. 2014;8:50

Abstract

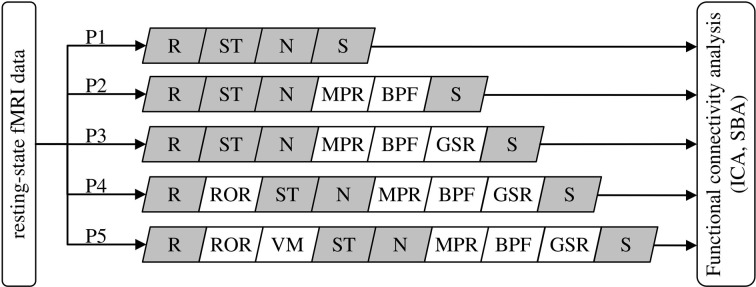
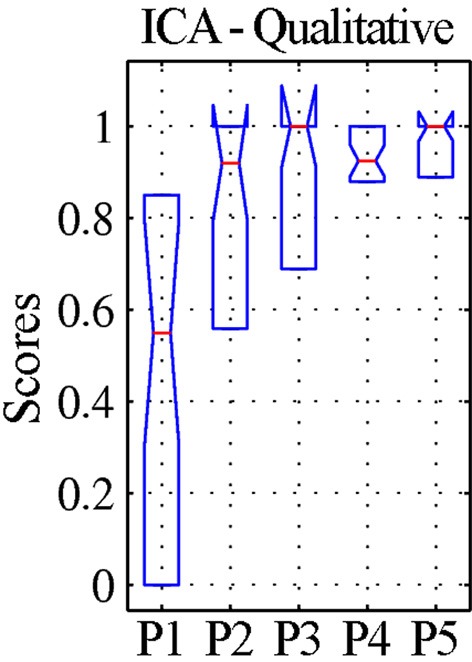
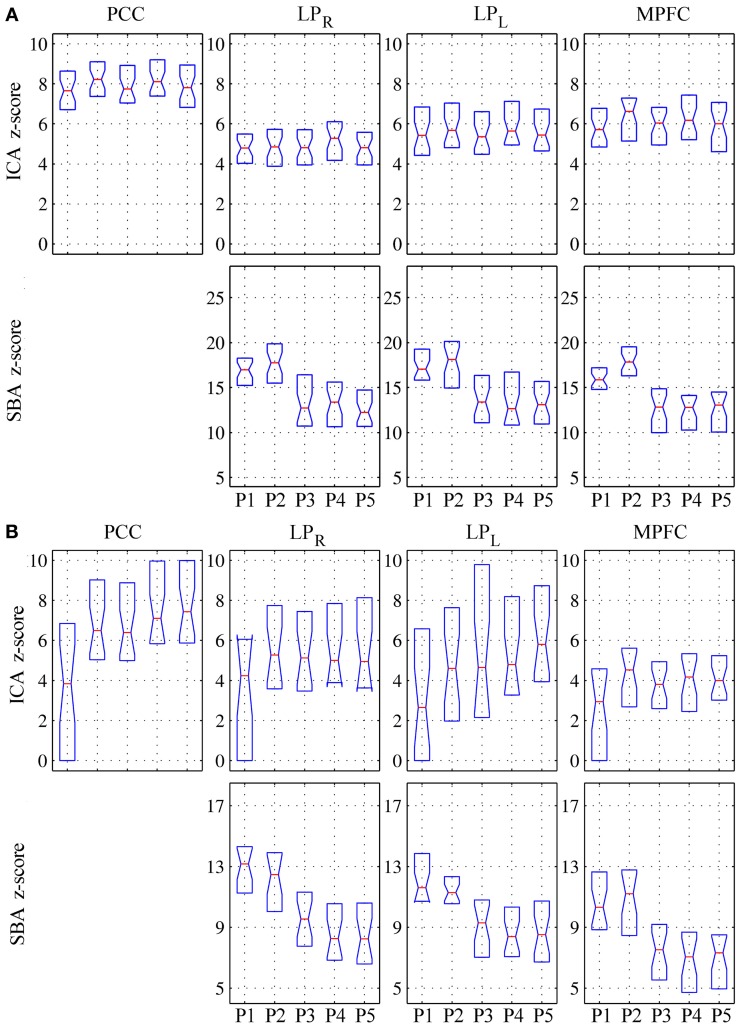
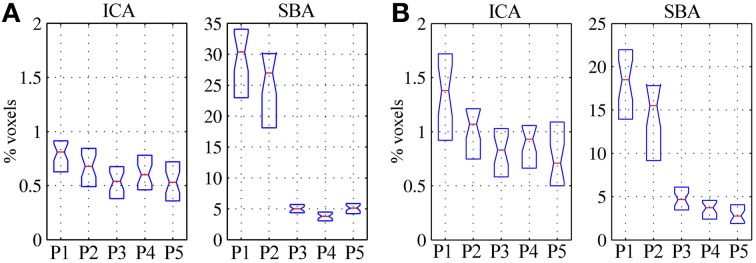
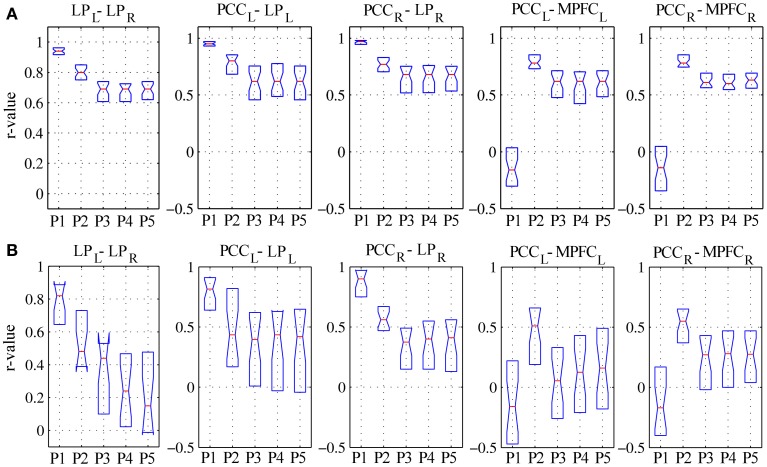
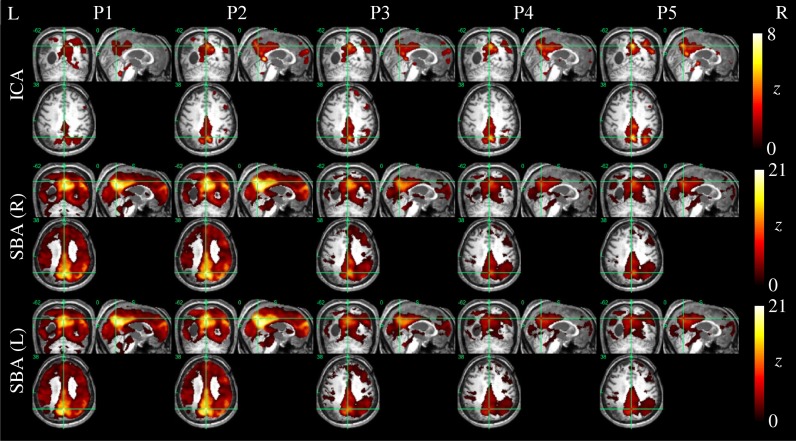
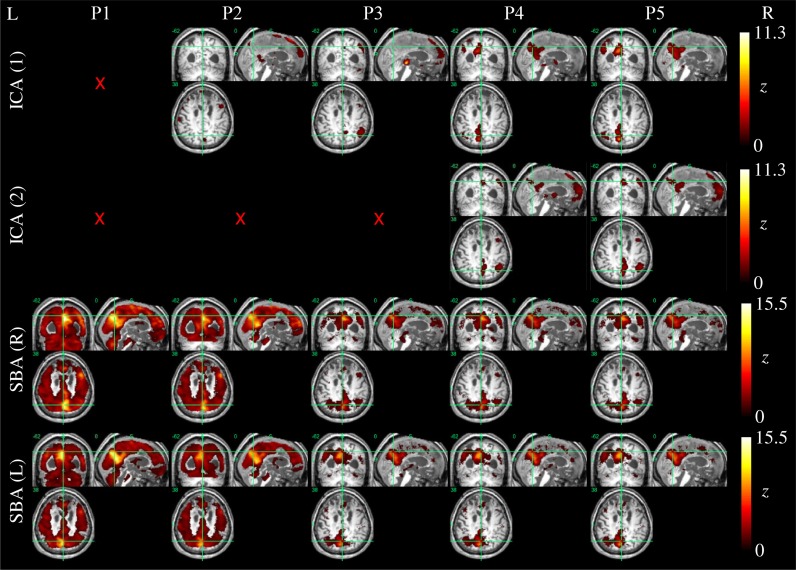
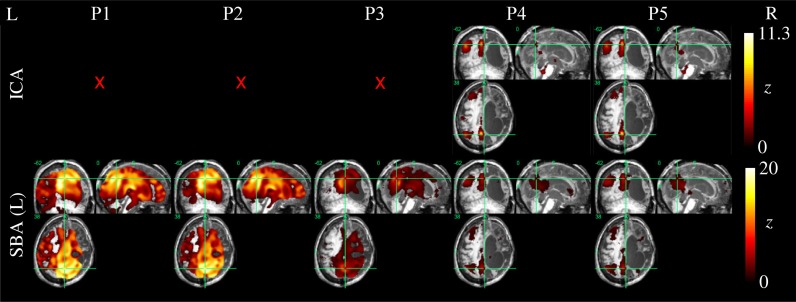
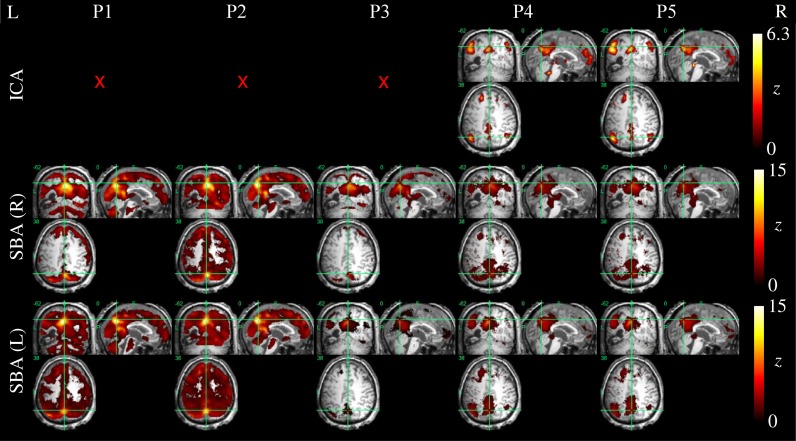
An emerging application of resting-state functional MRI (rs-fMRI) is the study of patients with disorders of consciousness (DoC), where integrity of default-mode network (DMN) activity is associated to the clinical level of preservation of consciousness. Due to the inherent inability to follow verbal instructions, arousal induced by scanning noise and postural pain, these patients tend to exhibit substantial levels of movement. This results in spurious, non-neural fluctuations of the rs-fMRI signal, which impair the evaluation of residual functional connectivity. Here, the effect of data preprocessing choices on the detectability of the DMN was systematically evaluated in a representative cohort of 30 clinically and etiologically heterogeneous DoC patients and 33 healthy controls. Starting from a standard preprocessing pipeline, additional steps were gradually inserted, namely band-pass filtering (BPF), removal of co-variance with the movement vectors, removal of co-variance with the global brain parenchyma signal, rejection of realignment outlier volumes and ventricle masking. Both independent-component analysis (ICA) and seed-based analysis (SBA) were performed, and DMN detectability was assessed quantitatively as well as visually. The results of the present study strongly show that the detection of DMN activity in the sub-optimal fMRI series acquired on DoC patients is contingent on the use of adequate filtering steps. ICA and SBA are differently affected but give convergent findings for high-grade preprocessing. We propose that future studies in this area should adopt the described preprocessing procedures as a minimum standard to reduce the probability of wrongly inferring that DMN activity is absent.

Keywords: data preprocessing; disorders of consciousness; functional MRI (fMRI); functional connectivity; minimally-conscious state; resting-state; vegetative state.


Figures

Figure 1
Figure 1
Definition of the data preprocessing pipeline for the five procedures (P1–P5) under comparison. R, realignment; ST, slice-timing correction; N, normalization to MNI space; S, spatial smoothing; MPR, removal of co-variance with movement parameters; BPF, band-pass filtering; GSR, removal of global parenchymal signal; ROR, removal of realignment outliers; VM, ventricle masking. The modules in gray are standard SPM8 functions, the others are functions developed in-house (see text).
Figure 2
Figure 2
Qualitative evaluation of the detectability of the whole default-mode network (DMN) extracted by ICA for patients. The values represent visual assessment scores for activity across the four main nodes (PCC, precuneus; LPR, right lateral parietal cortex; LPL, left lateral parietal cortex; MPFC, medial prefrontal cortex), averaged between the two raters and normalized within each patient, so that the maximum score of 1 corresponds to the best qualitative appearance of the DMN observed for each case (see text). The box-plots represent the median and inter-quartile ranges of the visual assessment scores. As preprocessing steps were added to the pipeline (P1–P5), the dispersion diminished and the median approached unity, confirming that the DMN was best identifiable after preprocessing using procedure P5.
Figure 3
Figure 3
Peak z-scores for activity within the four main DMN nodes for (A) healthy controls and (B) patients. Top row: DMN component extracted by ICA; bottom row: correlation maps computed using precuneus seeds (SBA). As preprocessing steps were added to the pipeline (P1–P5), the median z-scores for the DMN component extracted through ICA generally increased, indicating better component extraction, whereas the z-scores from SBA diminished (see text for comment and Figures 6–9).
Figure 4
Figure 4
Volume of significant activations (z = 2) outside the regions-of-interest covering the expected DMN nodes (i.e., PCC, LPR, LPL, and MPFC), for the DMN maps extracted through ICA (left) and SBA (right), expressed as percent with respect to the parenchymal volume for (A) healthy controls and (B) patients. As preprocessing steps were added to the pipeline (P1–P5), the extent of activations outside the expected localization of the DMN was progressively reduced, representing greater specificity of the functional connectivity maps; the effect was considerably more marked for SBA than ICA.
Figure 5
Figure 5
Linear correlation coefficients for regionally-averaged BOLD signal time-series between DMN regions for (A) healthy controls and (B) patients. See text for description of the results.
Figure 6
Figure 6
DMN functional connectivity maps computed with ICA (top row) and SBA (middle and bottom rows) for a patient with a clinical diagnosis of vegetative state (maximum displacement 4.0 mm, 27/200 outlier volumes). As preprocessing steps were added (left to right, P1–P5), activity in the right angular gyrus became more evident on the ICA maps. For SBA, enhanced preprocessing had the effect of progressively reducing the diffuse correlations observed throughout the brain, revealing a topographical pattern that converged to that extracted by ICA.
Figure 7
Figure 7
DMN functional connectivity maps computed with ICA (top row) and SBA (middle and bottom rows) for a patient with a clinical diagnosis of vegetative state (maximum displacement 0.8 mm, 3/200 outlier volumes); red crosses denote inability to identify DMN activity in any of the 20 components extracted by ICA. As preprocessing grade was elevated (left to right, P1–P5), coherent activity between the precuneus and the angular gyri became identifiable through ICA and SBA. Notably, in this patient an apparent “split” between left and right DMN connectivity was observed through both analyses.
Figure 8
Figure 8
DMN functional connectivity maps computed with ICA (top row) and SBA (middle and bottom rows) for a patient with a clinical diagnosis of minimally-conscious state (maximum displacement 20.3 mm, 16/200 outlier volumes); red crosses denote inability to identify DMN activity in any of the 20 components extracted by ICA. Due to the gross anatomical damage visible on the volumetric T1 scan, SBA with the right precuneus seed was not performed. Here, elevating preprocessing grade (left to right, P1–P5) revealed coherent activity between the left precuneus and angular gyrus: applying procedures 4 and 5, ICA decomposition became able to orthogonalize activity for this preserved DMN subset, and SBA maps were “cleaned” of unspecific physiological fluctuations that originally extended to areas of gross anatomical damage.
Figure 9
Figure 9
DMN functional connectivity maps computed with ICA (top row) and SBA (middle and bottom rows) for a patient with a clinical diagnosis of minimally-conscious state (maximum movement 5.0 mm, 24/200 outlier volumes); red crosses denote inability to identify DMN activity in any of the 20 components extracted by ICA. Here, applying procedures 4 and 5 made ICA decomposition capable of revealing coherent activity between the precuneus, angular gyri and a cluster in the left superior frontal lobe. For SBA, a non-monotonic effect is evident, whereby applying procedure 3 removed substantial unspecific covariation across the brain parenchyma, and the subsequent steps implemented in procedures 4 and 5 revealed coherent activity between the precuneus, angular gyrus and superior frontal lobe.

References

    1. Allen E. A., Erhardt E. B., Damaraju E., Gruner W., Segall J. M., Silva R. F., et al. (2011). A baseline for the multivariate comparison of resting-state networks. Front. Syst. Neurosci. 5:2 10.3389/fnsys.2011.00002 - DOI - PMC - PubMed
    1. Beall E. B. (2010). Adaptive cyclic physiologic noise modeling and correction in functional MRI. J. Neurosci. Methods 187, 216–228 10.1016/j.jneumeth.2010.01.013 - DOI - PubMed
    1. Biswal B. B., Mennes M., Zuo X. N., Gohel S., Kelly C., Smith S. M., et al. (2010). Toward discovery science of human brain function. Proc. Natl. Acad. Sci. U.S.A. 107, 4734–4739 10.1073/pnas.0911855107 - DOI - PMC - PubMed
    1. Birn R. M., Diamond J. B., Smith M. A., Bandettini P. A. (2006). Separating respiratory-variation-related fluctuations from neuronal-activity-related fluctuations in fMRI. Neuroimage 31, 1536–1548 10.1016/j.neuroimage.2006.02.048 - DOI - PubMed
    1. Boly M., Tshibanda L., Vanhaudenhuyse A., Noirhomme Q., Schnakers C., Ledoux D., et al. (2009). Functional connectivity in the default network during resting state is preserved in a vegetative but not in a brain dead patient. Hum. Brain Mapp. 30, 2393–2400 10.1002/hbm.20672 - DOI - PMC - PubMed

LinkOut - more resources