. 2013 Aug 23:5:5.
doi: 10.3389/fnsyn.2013.00005. eCollection 2013.

The temporoammonic input to the hippocampal CA1 region displays distinctly different synaptic plasticity compared to the Schaffer collateral input in vivo: significance for synaptic information processing

Affiliations

The temporoammonic input to the hippocampal CA1 region displays distinctly different synaptic plasticity compared to the Schaffer collateral input in vivo: significance for synaptic information processing

Ayla Aksoy-Aksel et al. Front Synaptic Neurosci. .

Abstract

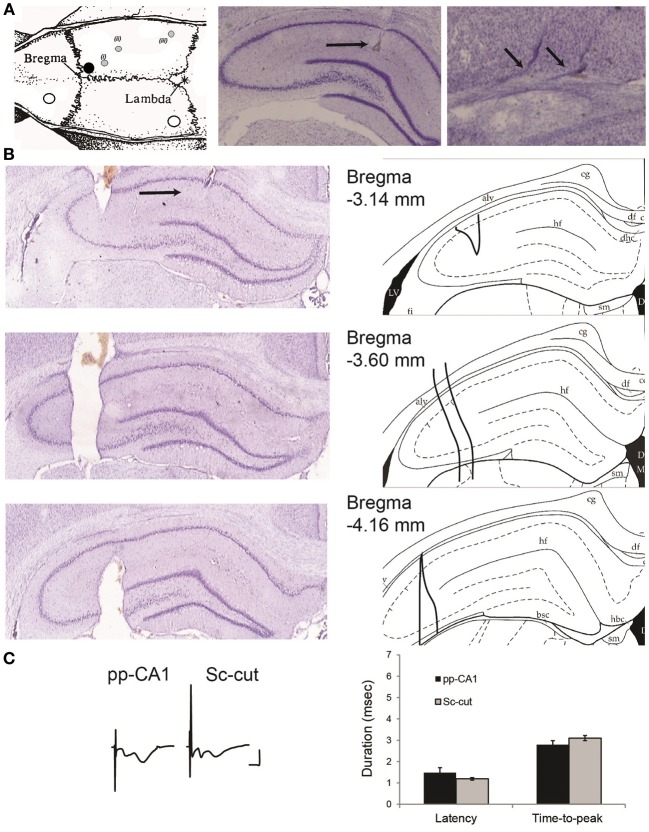
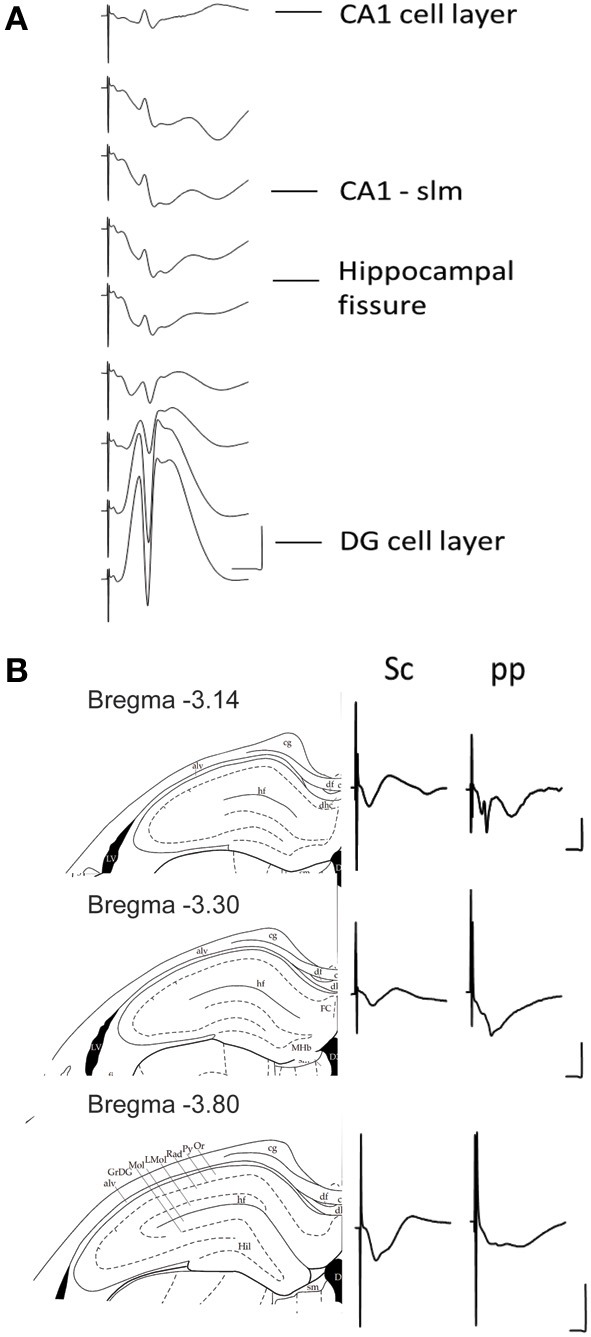
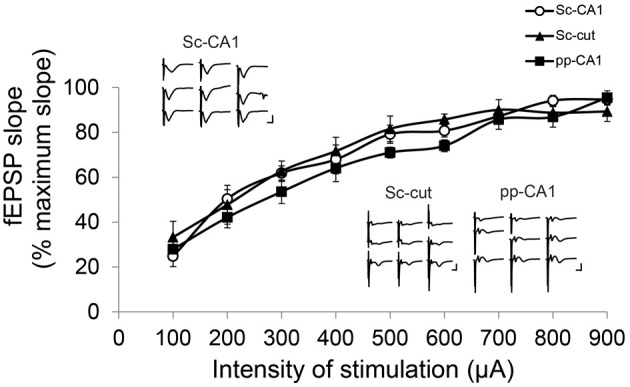
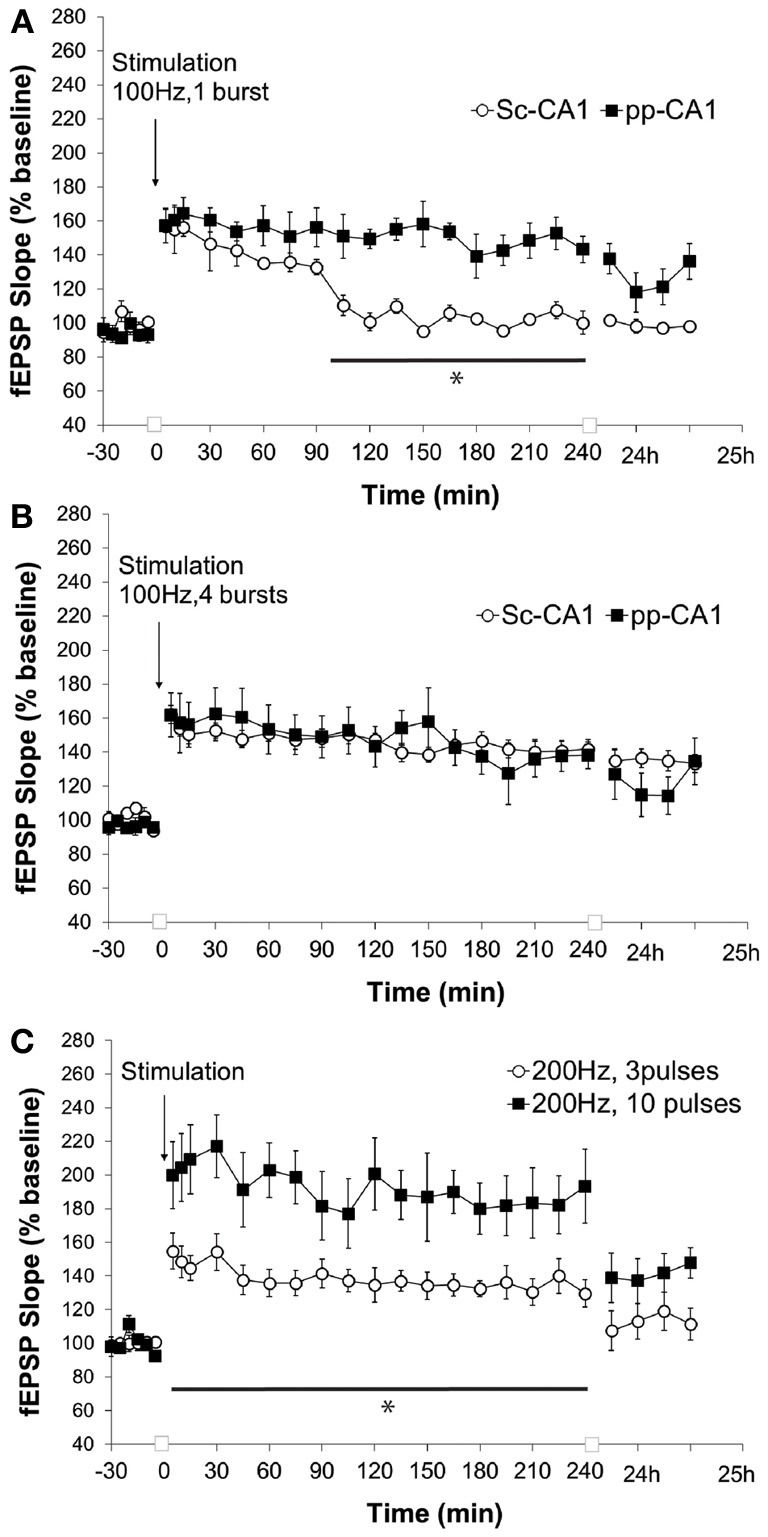
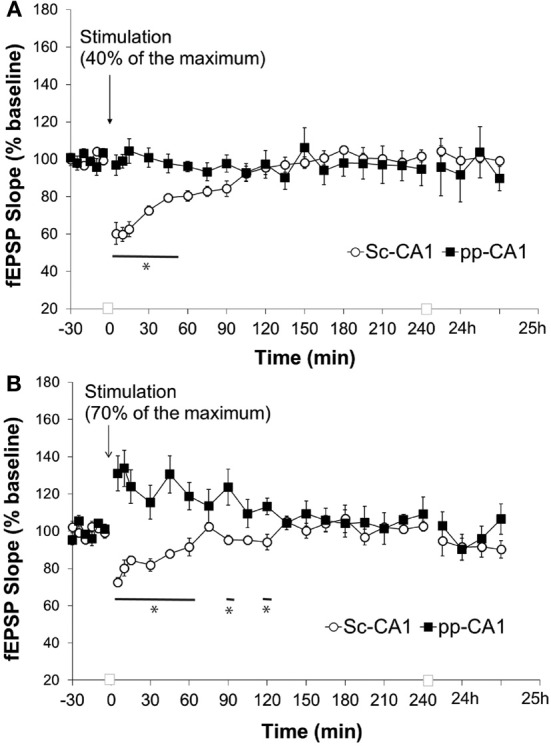
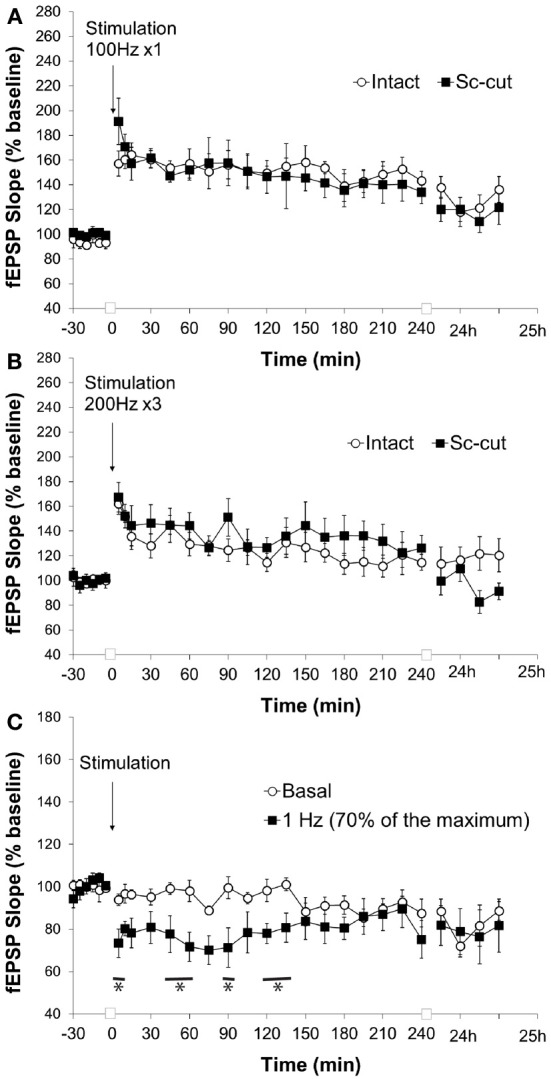
In terms of its sub-regional differentiation, the hippocampal CA1 region receives cortical information directly via the perforant (temporoammonic) path (pp-CA1 synapse) and indirectly via the tri-synaptic pathway where the last relay station is the Schaffer collateral-CA1 synapse (Sc-CA1 synapse). Research to date on pp-CA1 synapses has been conducted predominantly in vitro and never in awake animals, but these studies hint that information processing at this synapse might be distinct to processing at the Sc-CA1 synapse. Here, we characterized synaptic properties and synaptic plasticity at the pp-CA1 synapse of freely behaving adult rats. We observed that field excitatory postsynaptic potentials at the pp-CA1 synapse have longer onset latencies and a shorter time-to-peak compared to the Sc-CA1 synapse. LTP (>24 h) was successfully evoked by tetanic afferent stimulation of pp-CA1 synapses. Low frequency stimulation evoked synaptic depression at Sc-CA1 synapses, but did not elicit LTD at pp-CA1 synapses unless the Schaffer collateral afferents to the CA1 region had been severed. Paired-pulse responses also showed significant differences. Our data suggest that synaptic plasticity at the pp-CA1 synapse is distinct from the Sc-CA1 synapse and that this may reflect its specific role in hippocampal information processing.

Keywords: CA1; LTD; LTP; hippocampus; in vivo; perforant path; synaptic plasticity.


Figures

Figure 1
Figure 1
(A) Location of the drilled holes on the rat skull and electrodes. Left: the white circles indicate the position of the ground and reference screws. The black circle signifies the position of the guiding cannula that reaches the lateral ventricle. The gray circles show the planar position of (i) the recording electrode, (ii) the stimulating electrode for Schaffer collaterals and (iii) the stimulating electrode for the perforant path (angular bundle) [Modified from Paxinos and Watson (1998)]. The animals were implanted with a stimulation electrode either in the Schaffer collateral (Sc) fibers (ii) or angular bundle (iii) if not indicated otherwise. Middle: location of the recording electrode for the perforant path (pp)-CA1 synapse (black horizontal arrow). Right: tracks of a bipolar stimulating electrode at the angular bundle (small angled arrows). Middle and right: Nissl-stained hippocampal slices. (B) Histological verification of the severence of the Schaffer collateral input. Left: Nissl-stained hippocampal slices from an animal with severed Schaffer collateral input (black arrow points the recording site). Right: the corresponding drawings from the atlas for easier interpretation (Paxinos and Watson, 1998). Distance from bregma as indicated. alv, alveus of the hippocampus; df, dorsal fornix; hf, hippocampal fissure; LV, lateral ventricle. (C) fEPSP characteristics of intact and Sc-cut groups. Left: Examples of evoked potentials from intact (pp-CA1) and Sc severed (Sc-cut) animals. Vertical scale bar: 4 mV, horizontal scale bar: 5 ms. Right: Latency and time-to-peak values for the two groups (no significant difference, n = 6).
Figure 2
Figure 2
(A) Depth profile of evoked potentials as a result of perforant path stimulation. Example of typical field responses in vivo evoked by perforant path stimulation. The recordings started at the granule cell layer of the dentate gyrus (DG). The depth was decreased stepwise at 5 min intervals progressing “backwards” to the CA1 region. The distance between each representative recording was 160 μm. The stimulation intensity for all recordings was 200 μ A. Vertical scale bar: 5 mV, horizontal scale bar: 3 ms. (B) Evoked potentials at the CA1-stratum lacunosum moleculare synapse in response to Schaffer collateral and perforant path stimulation. Examples of typically evoked responses in vivo at the CA1-slm as a result of Schaffer collateral (analogs on the left) and perforant path stimulation (analogs traces on the right) at three different anterioposterior coordinates. The diagrams to the left of the analog traces represent coronal sections of hippocampal formation −3.14 mm (Top), −3.30 mm (middle), and −3.80 mm (bottom) from bregma (Paxinos and Watson, 1998). The histological examination of the recording site was depicted as a dot on the corresponding slide (Paxinos and Watson, 1998). All of the recordings were taken from freely behaving rats. The stimulation intensity for all recordings was 200 μ A. Vertical scale bar: 5 mV, horizontal scale bar: 5 ms for all traces. alv, alveus of the hippocampus; cg, cingulum; df, dorsal fornix; FC, fasciola cinereun; GrDG, granular layer of the dentate gyrus; hf, hippocampal fissure; Hil, hilus of the dentate gyrus; LMol, lacunosum moleculare layer of the hippocampus; Mol, molecular layer of the dentate gyrus; Or, oriens layer of the hippocampus; Py, pyramidal cell layer of the hippocampus; Rad, stratum radiatum of the hippocampus.
Figure 3
Figure 3
Input/Output characteristics for the Sc-CA1, pp-CA1, and Sc-cut synapse. The fEPSP slope was recorded as the maximum slope from the beginning of the potential to the first minimum value for each subject. For each intensity of stimulation the values are expressed as percentage of the highest value obtained. There was no significant difference between Sc-CA1, SC-severed (Sc-cut) or pp-CA1 groups (n = 8 for Sc-CA1, n = 8 for Sc-cut and n = 9 for pp-CA1). Typical evoked responses from Sc-CA1, Sc-cut, and pp-CA1 animals embedded in the chart. Increasing the stimulation intensity stepwise (100–900 μA, step size 100 μA) complicated the analysis of the fEPSPs from the pp-CA1 and Sc-cut synapse to same extent. Vertical scale bar: 3 mV, horizontal scale bar: 5 ms.
Figure 4
Figure 4
The paired-pulse ratio is different for pp-CA1 and Sc-CA1 synapse depending on stimulus intensity. (A) Left: Paired-pulse ratio profiles for pp-CA1 and Sc-CA1 synapses at low-intensity stimulation (corresponding to the intensity necessary to evoke 40% of the maximum). Right: Example of fEPSPs evoked from corresponding synapse and interstimulus interval (Vertical scale bar: 4 mV, horizontal scale bar: 5 ms for all) (B) Left: Paired-pulse ratio profiles for pp-CA1 synapses and for the Sc-CA1 synapses at high-intensity levels (double the low-intensity or maximum of 400 μA). Increasing the stimulation intensity did not result in a significant change for the pp-CA1 synapse but led to paired-pulse depression at all interstimulus intervals for the Sc-CA1 synapse. The paired-pulse intervals used were: 20, 25, 40, 50, and 100 ms for both groups. All the recordings were collected from awake unrestrained but stationary animals. *indicates p < 0.05 (Student's t-test). Right: Example of fEPSPs evoked from corresponding synapse and interstimulus interval (Vertical scale bar: 4 mV, horizontal scale bar: 5 ms).
Figure 5
Figure 5
High frequency stimulation (100 Hz) at different strengths elicits LTP of differing durations at the pp-CA1 and Sc-CA1 synapses. (A) High frequency stimulation (HFS) with a weak tetanus of 100 Hz (1 burst of 100 pulses) resulted in short term potentiation at the Sc-CA1 synapse and LTP at the pp-CA1 synapse in freely behaving rats. Synaptic potentiation at pp-CA1 synapses was significantly more prolonged than potentiation at SC-CA1 synapses (ANOVA). The line with the asterisk indicates individual time-points that were determined to be significant in the pp-CA1 responses compared to the Sc-CA1 responses, using post-hoc Fisher's LSD test. (B) Strong HFS with 100 Hz (4 bursts of 100 pulses) elicited comparable potentiation at the two synapses. (C) HFS with a weak or strong tetanus of 200 Hz [3 bursts (wHFS) or 10 bursts (HFS)] resulted in LTP of differing amplitude at pp-CA1 fEPSPs from freely behaving rats. LTP elicited with 200 Hz, 10 pulses was significantly larger than LTP elicited with 200 Hz, 3 pulses (ANOVA). The line with the asterisk indicates individual time-points in the 10 pulse group that were determined to be significant from the 3 pulse group, using post-hoc Fisher's LSD test.
Figure 6
Figure 6
Low frequency stimulation induces short-term depression at the Sc-CA1 synapse irrespective of stimulation intensity but potentiates the pp-CA1 synapse with high-intensity. (A) Low frequency stimulation (LFS, 1 Hz, 600 pulses) with low-intensity stimulation (to evoke 40% of the maximum evoked response) did not have any effect at the pp-CA1 synapse in freely behaving rats, whereas short-term depression was elicited at SC-CA1 synapses. Sc-CA1 depression was significant compared to evoked potentials at pp_CA1 synapses (ANOVA). The line with the asterisk indicates individual time-points in SC-CA1 responses that were determined to be significant from the pp-CA1 responses, using post-hoc Fisher's LSD test. (B) LFS (1 Hz, 600 pulses) with high-intensity stimulation (to evoke 70% of the maximum evoked response) resulted in potentiation at the pp-CA1 synapse in freely behaving rats and short-term depression in the Sc-CA1 synapses. The lines marked with asterisks indicate individual time-points in SC-CA1 responses that were determined to be significant from the pp-CA1 responses, using post-hoc Fisher's LSD test.
Figure 7
Figure 7
Severence of CA3 input affects the response of the pp-CA1 synapse to LFS but not HFS. (A) High frequency stimulation (HFS) with a weak tetanus of 100 Hz (1 burst of 100 pulses) resulted in potentiation in freely behaving rats with intact and Sc-cut conditions. (B) High frequency stimulation with a weak tetanus of 200 Hz (3 burst of 15 pulses) resulted in potentiation in freely behaving rats with intact and Sc-cut conditions. (C) Low frequency stimulation (1 Hz, 600 pulses) resulted in depression at the pp-CA1 synapse in freely behaving rats with a severed Schaffer collateral input compared to responses evoked in the same synapses by test-pulse stimulation (ANOVA). The lines marked with asterisks indicate individual time-points representing evoked responses after 1 Hz stimulation that were determined to be significant from test-pulse evoked responses, using post-hoc Fisher's LSD test.

References

    1. Ahmed M. S., Siegelbaum S. A. (2009). Recruitment of N-Type Ca(2+) channels during LTP enhances low release efficacy of hippocampal CA1 perforant path synapses. Neuron 63, 372–385 10.1016/j.neuron.2009.07.013 - DOI - PMC - PubMed
    1. Ang C. W. (2005). Hippocampal CA1 circuitry dynamically gates direct cortical inputs preferentially at theta frequencies. J. Neurosci. 25, 9567–9580 10.1523/JNEUROSCI.2992-05.2005 - DOI - PMC - PubMed
    1. Bear M. F., Abraham W. C. (1996). Long-term depression in hippocampus. Annu. Rev. Neurosci. 19, 437–462 10.1146/annurev.ne.19.030196.002253 - DOI - PubMed
    1. Brun V. H., Otnass M. K., Molden S., Steffenach H. A., Witter M. P., Moser M. B., et al. (2002). Place cells and place recognition maintained by direct entorhinal-hippocampal circuitry. Science 296, 2243–2246 10.1126/science.1071089 - DOI - PubMed
    1. Buzsaki G., Penttonen M., Bragin A., Nadasdy Z., Chrobak J. J. (1995). Possible physiological role of the perforant path-CA1 projection. Hippocampus 5, 141–146 10.1002/hipo.450050210 - DOI - PubMed