. 2013 Aug 27:4:540.
doi: 10.3389/fpsyg.2013.00540. eCollection 2013.

Abnormal task modulation of oscillatory neural activity in schizophrenia

Affiliations

Abnormal task modulation of oscillatory neural activity in schizophrenia

Elisa C Dias et al. Front Psychol. .

Abstract

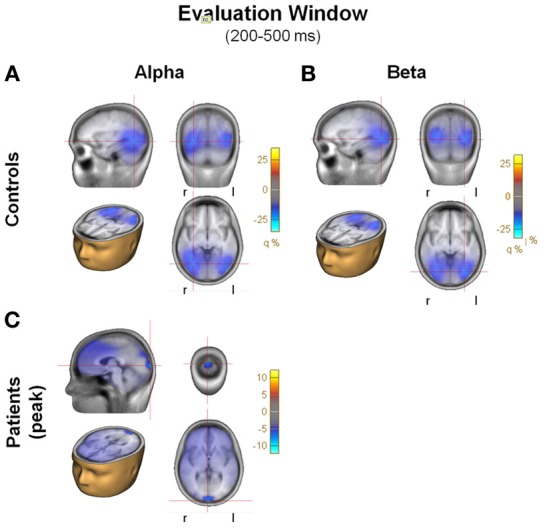
Schizophrenia patients have deficits in cognitive function that are a core feature of the disorder. AX-CPT is commonly used to study cognition in schizophrenia, and patients have characteristic pattern of behavioral and ERP response. In AX-CPT subjects respond when a flashed cue "A" is followed by a target "X," ignoring other letter combinations. Patients show reduced hit rate to "go" trials, and increased false alarms to sequences that require inhibition of a prepotent response. EEG recordings show reduced sensory (P1/N1), as well as later cognitive components (N2, P3, CNV). Behavioral deficits correlate most strongly with sensory dysfunction. Oscillatory analyses provide critical information regarding sensory/cognitive processing over and above standard ERP analyses. Recent analyses of induced oscillatory activity in single trials during AX-CPT in healthy volunteers showed characteristic response patterns in theta, alpha, and beta frequencies tied to specific sensory and cognitive processes. Alpha and beta modulated during the trials and beta modulation over the frontal cortex correlated with reaction time. In this study, EEG data was obtained from 18 schizophrenia patients and 13 controls during AX-CPT performance, and single trial decomposition of the signal yielded power in the target wavelengths. Significant task-related event-related desynchronization (ERD) was observed in both alpha and beta frequency bands over parieto-occipital cortex related to sensory encoding of the cue. This modulation was reduced in patients for beta, but not for alpha. In addition, significant beta ERD was observed over motor cortex, related to motor preparation for the response, and was also reduced in patients. These findings demonstrate impaired dynamic modulation of beta frequency rhythms in schizophrenia, and suggest that failures of oscillatory activity may underlie impaired sensory information processing in schizophrenia that in turn contributes to cognitive deficits.

Keywords: AX-CPT; alpha; beta; cognitive; motor preparation; oscillations; schizophrenia.


Figures

Figure 1
Figure 1
Path analysis results in the AX-70 task variant [from Dias et al. (2011), online only materials]. Component variables were overlaid on a schematic brain based upon generator locations derived from source analysis (Dias et al., 2003), monkey intracranial recordings (Dias et al., 2006), and prior fMRI studies (Barch et al., 2003). Arrows reflect significant statistical associations as shown by path analysis, with thickness of arrow representing strength of connection. CMIN/DF of the model was 1.109, and RMSEA was 0.052. For statistics, P1 values were collapsed across A- and B-cues, which were not significantly different (p > 0.2). For more information, see Dias et al. (2011).
Figure 2
Figure 2
Comparison of the grouped data at four original recording electrodes (left panel) and the virtual electrode representing that scalp region (right panel).
Figure 3
Figure 3
(A) Spatial distribution of the P1 component of the event related potential on the scalp, seen from behind the head, on both healthy controls (top panel) and schizophrenia patients (bottom panel). (B) Power of the evoked potential, obtained by extracting the frequency components of the averaged trials. (C) T-test comparison between patients and controls. The results are masked to only show t-values with a p < 0.05.
Figure 4
Figure 4
Evaluation window. (A) Top view of the spatial distribution of beta induced power during the evaluation period, for task AX-70; the red oval represents the scalp region in the occipito-parietal region that was used for the statistical analysis. The data for healthy controls are on top panels and for schizophrenia patients on the bottom panels. (B) Time-frequency distribution of activity in the occipito-parietal region following cue A onset (time 0), adjusted for power of the different frequencies (i.e., power multiplied by the specific frequency), for tasks AX-70 (left) and BX-70 (right). The black dotted rectangle represents the time-frequency window used for the analysis of beta power, and the red dotted rectangle represents the window for the alpha power. (C) Top view of the spatial distribution of the alpha induced activity for task AX-70.
Figure 5
Figure 5
Evaluation window. (A) Location of the electrodes over the occipito-posterior scalp from which the data was derived. (B) Variation of the alpha ERD with the probability ratio for all three task variations, for cue A. There were no significant effects. (C) Variation of the beta ERD with probability ratio for all three task variations, for cue A (Table 2). There was a significant group difference and an interaction of task by cue. (D) Relation of the difference in beta ERD between cue A and B and performance measured by d' context, with linear trendline for all data points.
Figure 6
Figure 6
(A) Beamformer images of the sources of activity for alpha and beta during the evaluation window, plotted on the BESA standard anatomical MRI. Each panel includes 4 images of the peak of the activity: saggital, coronal, horizontal in head, horizontal. Blobs represent location of the grid maximums. Note the large differences in scale between controls and patients. (A) Alpha, controls; (B) Beta, controls; (C) Alpha, patients.
Figure 7
Figure 7
Preparation window. (A) Top view of the spatial distribution of beta induced power in the preparation period for task AX-70; the black oval represents the scalp region in the left fronto-central region. In (A), (B), and (C), the data for healthy controls are on top panels and for schizophrenia patients on the bottom panels. (B) Time-frequency distribution of activity in the left fronto-central region adjusted for power of the different frequencies, for task AX-70. The red dotted square represents the time-frequency window used for the analysis of beta power, and the black dotted square represents the window for the alpha power, a little earlier (0.9–1.1 ms after cue onset). (C) Top view of the spatial distribution of the alpha activity for task AX-70.
Figure 8
Figure 8
Preparation window. (A) Relationship of preparation beta ERD with the probability of target probe X, given cue A, for the different task variations (Table 2). There were main effects of task and group. (B) Relationship of preparation beta ERD power and reaction time (in milliseconds), showing that as beta ERD in the preparation window decreases, the reaction time increases. (C) Variation of ongoing baseline beta power with the different tasks that create different expectations of responses. In controls, task AX-70, that has a higher probability of response, has a larger power of beta than the other tasks. (D) Location on the scalp of the left antero-medial electrodes used for statistical analysis.
Figure 9
Figure 9
(A) Beamformer images of the sources of activity for alpha and beta ERD during the preparation window, plotted on the BESA standard anatomical MRI. Each panel includes 4 images: saggital, coronal, horizontal in head, horizontal. Blobs represent location of the grid maximums. Note the large differences in the scales, especially between controls and patients. (A) Alpha, controls; (B) Beta, controls; (C) Alpha, patients.

References

    1. Alegre M., Imirizaldu L., Valencia M., Iriarte J., Arcocha J., Artieda J. (2006). Alpha and beta changes in cortical oscillatory activity in a go/no go randomly-delayed-response choice reaction time paradigm. Clin. Neurophysiol. 117, 16–25 10.1016/j.clinph.2005.08.030 - DOI - PubMed
    1. Ammons R., Ammons C. (1962). The Quick Test (QT): provisional manual. Psychol. Rep. 11, 111–162
    1. Andreasen N. C. (1984). The Scale for the Assessment of Negative Symptoms (SANS). Iowa City, IA: The University of Iowa - PubMed
    1. Barch D. M., Carter C. S., Braver T. S., Sabb F. W., MacDonald A., 3rd., Noll D.C., et al. (2001). Selective deficits in prefrontal cortex function in medication-naive patients with schizophrenia. Arch. Gen. Psychiatry 58, 280–288 10.1001/archpsyc.58.3.280 - DOI - PubMed
    1. Barch D. M., Carter C. S., MacDonald A. W., 3rd., Braver T. S., Cohen J. D. (2003). Context-processing deficits in schizophrenia: diagnostic specificity, 4-week course, and relationships to clinical symptoms. J. Abnorm. Psychol. 112, 132–143 10.1037/0021-843X.112.1.132 - DOI - PubMed

LinkOut - more resources