. 2013 Sep 24;7(9):8158-66.
doi: 10.1021/nn403447s. Epub 2013 Sep 6.

Robustly passivated, gold nanoaperture arrays for single-molecule fluorescence microscopy

Affiliations

Robustly passivated, gold nanoaperture arrays for single-molecule fluorescence microscopy

Colin D Kinz-Thompson et al. ACS Nano. .

Abstract

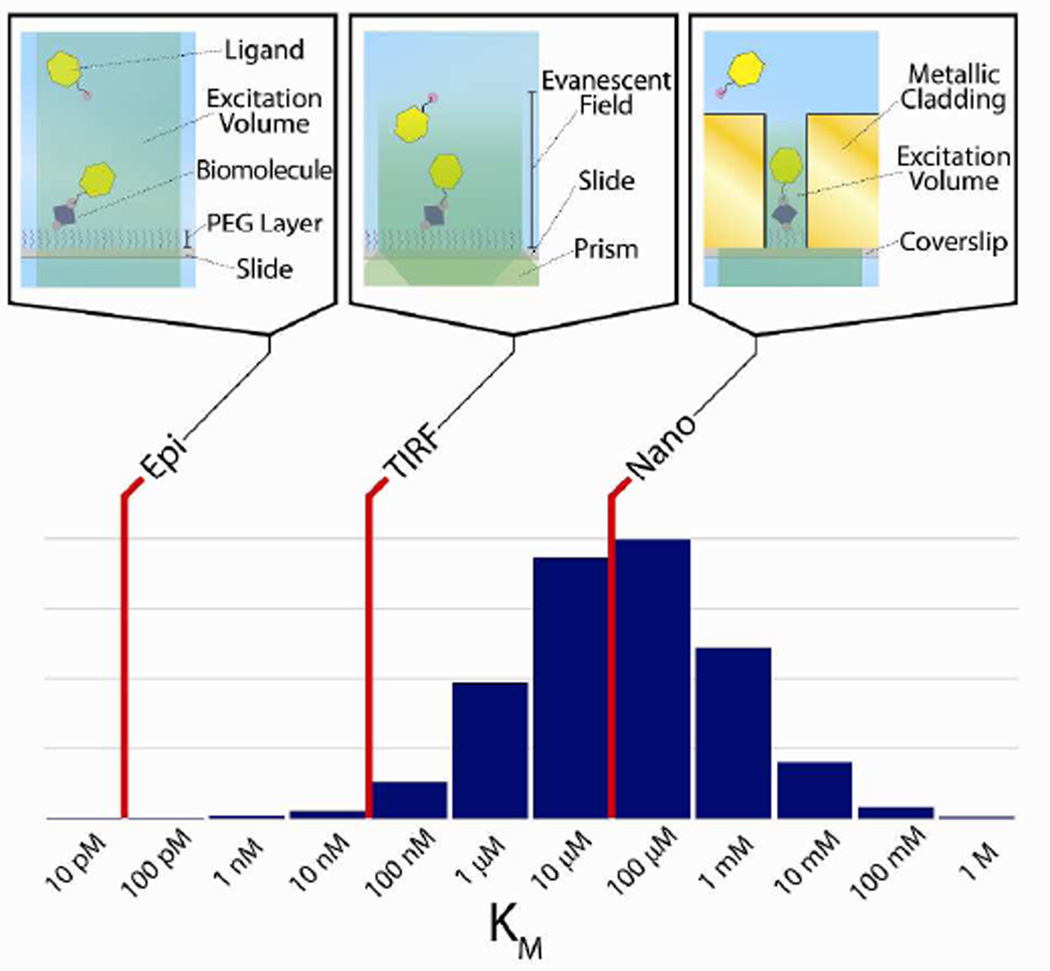
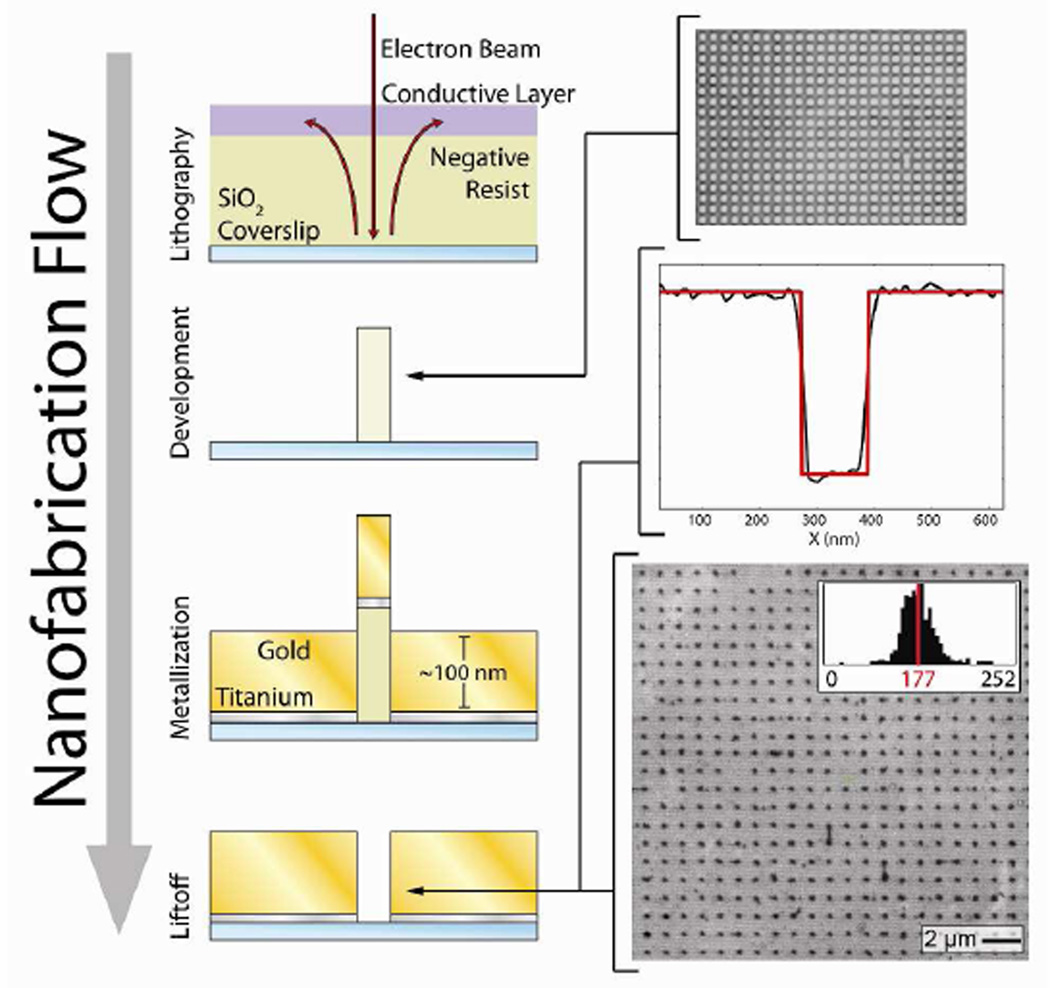
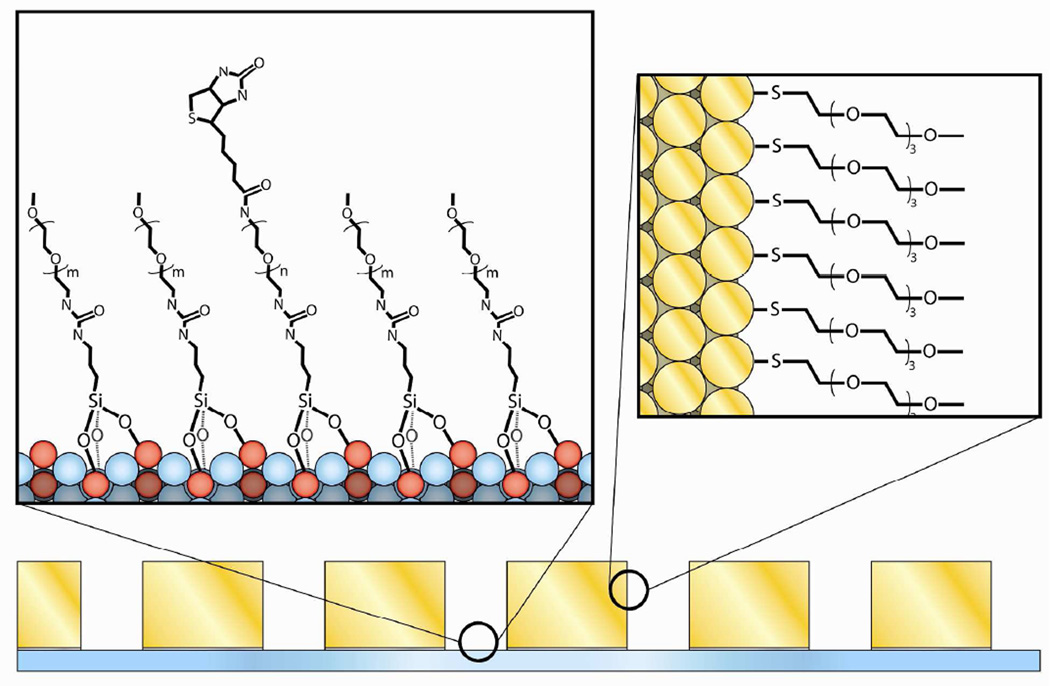
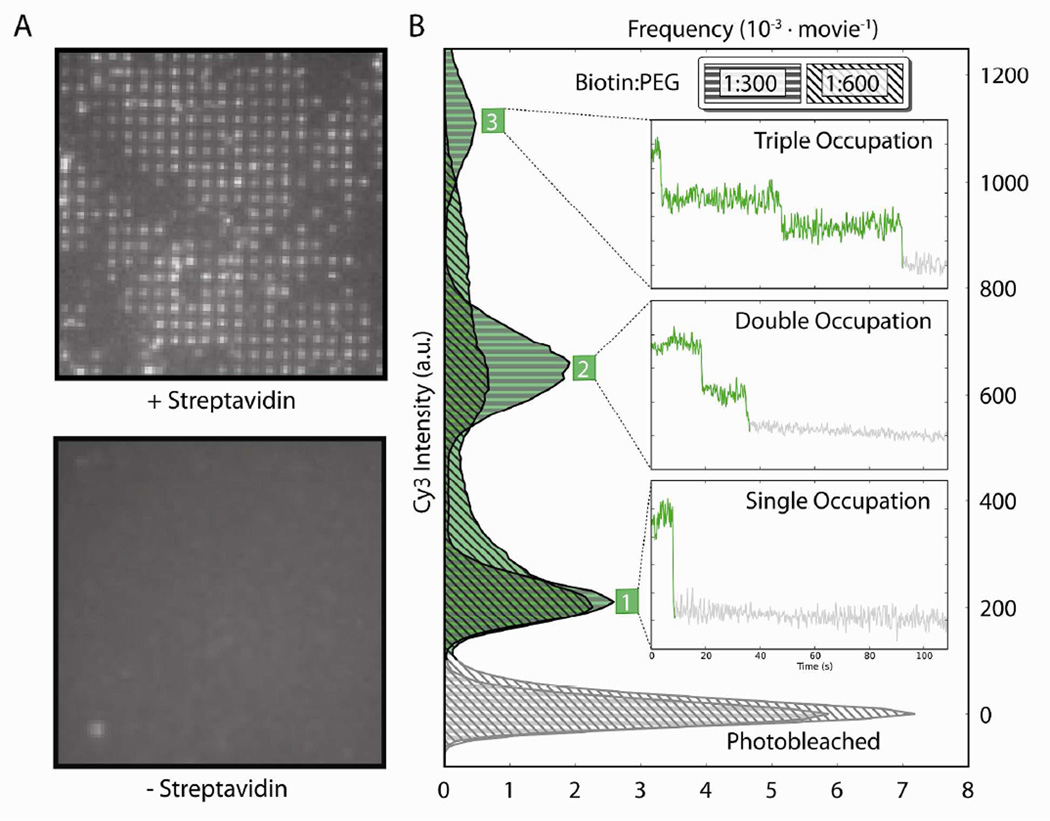
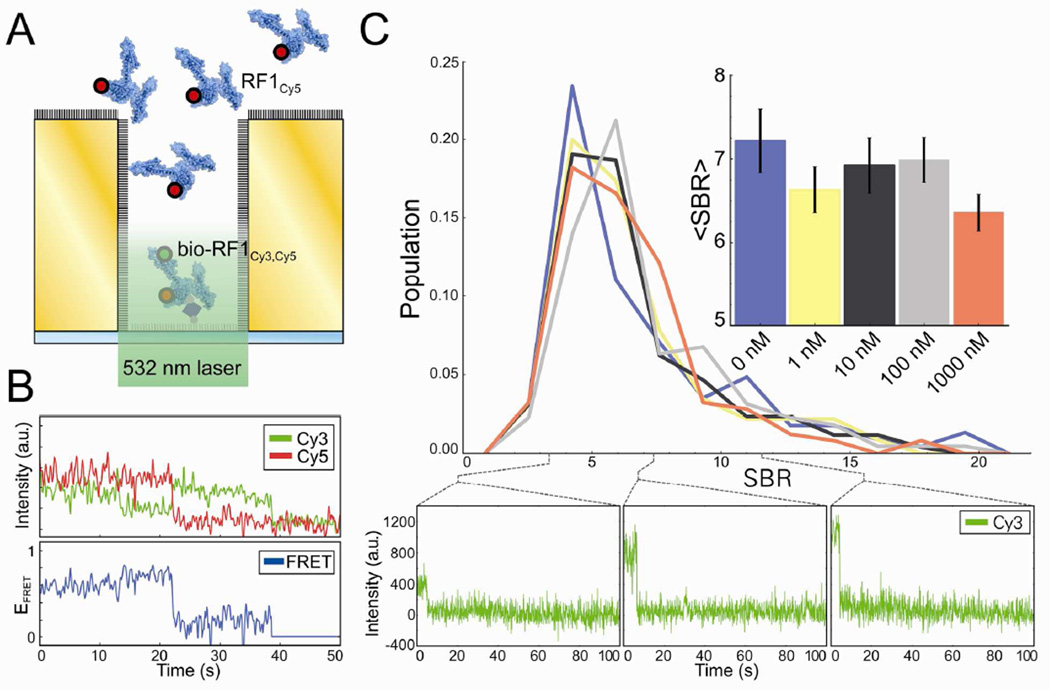
The optical confinement generated by metal-based nanoapertures fabricated on a silica substrate has recently enabled single-molecule fluorescence measurements to be performed at physiologically relevant background concentrations of fluorophore-labeled biomolecules. Nonspecific adsorption of fluorophore-labeled biomolecules to the metallic cladding and silica bottoms of nanoapertures, however, remains a critical limitation. To overcome this limitation, we have developed a selective functionalization chemistry whereby the metallic cladding of gold nanoaperture arrays is passivated with methoxy-terminated, thiol-derivatized polyethylene glycol (PEG), and the silica bottoms of those arrays are functionalized with a binary mixture of methoxy- and biotin-terminated, silane-derivatized PEG. This functionalization scheme enables biotinylated target biomolecules to be selectively tethered to the silica nanoaperture bottoms via biotin-streptavidin interactions and reduces the nonspecific adsorption of fluorophore-labeled ligand biomolecules. This, in turn, enables the observation of ligand biomolecules binding to their target biomolecules even under greater than 1 μM background concentrations of ligand biomolecules, thereby rendering previously impracticable biological systems accessible to single-molecule fluorescence investigations.


Figures

Figure 1
Figure 1
Diagram of concentration ranges accessible by various microscopy techniques. Red lines represent the upper limit of the background concentration of ligand biomolecules that can be employed in smF experiments using epi-fluorescence microscopy (Epi), TIRF microscopy (TIRF), and nanoaperture fluorescence microscopy (Nano). The microscope schematics connected to each red line provide molecular-level diagrams corresponding to each technique (upper panel). The histogram shows the distribution of Michaelis constants (KM), a characterization of the interactions between enzymes and their corresponding substrates, of all eukaryotic enzymes in the BRENDA enzyme database. This distribution is analogous to the distribution of background concentrations of ligand biomolecules required to observe interactions with a target biomolecule on an experimentally accessible timescale using smF microscopies (lower panel).
Figure 2
Figure 2
A schematic diagram of the nanoaperture fabrication process. Negative-tone electron-beam lithography crosslinks patterns in the negative resist on a silica coverslip; excess electrons are removed to a ground via a conductive layer. Pillars of patterned, cross-linked resist remain following substrate exposure to aqueous developer. The top panel shows a wide-field, optical microscope image of a pre-metallization pillar array. An optically transparent, adhesion layer of titanium is then deposited with electron-beam evaporation. Subsequently, a layer of gold is deposited with electron-beam evaporation, such that the cross-linked resist remains solvent exposed. Nanoapertures are formed in the relief of the pillars following solvent-based liftoff. The middle panel shows an atomic force microscope image cross-section of a typical nanoaperture; the red line is a boxcar function fit with a 115 nm step length. The bottom panel shows a scanning electron microscope image of a nanoaperture array, post-fabrication; the average diameter of the nanoapertures in this array is 177 ± 16 nm (1σ, n = 499).
Figure 3
Figure 3
Molecular-level schematic diagram of thiol and silane passivated surfaces. The gold surfaces of the nanoaperture arrays were passivated with a SAM formed using mPEG-SH, and the borosilicate surfaces of the nanoaperture arrays were passivated with a SAM formed using a binary mixture of biotin-PEG-Si and mPEG-Si.
Figure 4
Figure 4
(A) Streptavidin-dependence of nanoaperture occupation. After incubating bio-RF1Cy3,Cy5 in a flow cell with streptavidin, Cy3 fluorescence was observed in a pattern corresponding to that of the nanoaperture arrays, demonstrating that bio-RF1Cy3,Cy5 was specifically localized to the silica bottoms of the nanoapertures (upper panel); the nanofabrication defects described in the text result in the lack of fluorescence in some of the regions where nanoapertures should be located. After incubating bio-RF1Cy3,Cy5 in a second flowcell without streptavidin, Cy3 fluorescence was not observed from the nanoaperture array under the same imaging conditions; moreover, only minimal Cy3 fluorescence emission was observed from regions of bulk silica just proximal to the nanoaperture array (lower panel). (B) Tunable nanoaperture occupation. Histograms show the distributions of Cy3 fluorescence intensities observed over 100 seconds from nanoapertures in flow cells that had been passivated with a 1:300 or a 1:600 ratio of biotin-PEG-Si:mPEG-Si and then incubated with both bio-RF1Cy3,Cy5 and streptavidin. Insets show discrete photobleaching events in Cy3 fluorescence intensity versus time trajectories that contribute to the histogram peaks and correspond to the occupancy of bio-RF1Cy3,Cy5 in individual nanoapertures.
Figure 5
Figure 5
(A) Schematic diagram of a nanoaperture fluorescence microscopy experiment designed to simulate the effect of increasing background concentrations of a FRET acceptor-labeled ligand biomolecule on a FRET-based nanoaperture fluorescence microscopy experiment. (B) A typical FRET signal from a single bio-RF1Cy3,Cy5 in a nanoaperture. Cy3 and Cy5 fluorescence intensities versus time trajectories are plotted on top, and the corresponding EFRET versus time trajectory is plotted below. (C) Distributions of Cy3 SBRs (calculated as the change in Cy3 fluorescence intensity due to photobleaching divided by the standard deviation of pure background fluorescence) imaged with 0 nM (n=136), 1 nM (n=137), 10 nM (n=155), 100 nM (n=131), and 1000 nM (n=146) background concentrations of RF1Cy5. Representative Cy3 fluorescence intensity versus time trajectories at specific SBRs from the 1000 nM RF1Cy5 data set are shown below. The inset shows the average SBRs with bootstrapped, 1σ error bars (n=1000).

References

    1. Fersht AR. Structure and Mechanism in Protein Science. New York: W.H. Freeman and Co.; 1999. pp. 293–368.
    1. Tinoco I, Gonzalez RL. Biological Mechanisms, One Molecule at a Time. Genes Dev. 2011;25:1205–1231. - PMC - PubMed
    1. Levene MJ, Korlach J, Turner SW, Foquet M, Craighead HG, Webb WW. Zero-Mode Waveguides for Single-molecule Analysis at High Concentrations. Science. 2003;299:682–686. - PubMed
    1. Ha T, Enderle T, Ogletree DF, Chemla DS, Selvin PR, Weiss S. Probing the Interaction Between Two Single Molecules: Fluorescence Resonance Energy Transfer Between a Single Donor and a Single Acceptor. Proc. Natl. Acad. Sci. U.S.A. 1996;93:6264–6268. - PMC - PubMed
    1. Betzig E, Patterson GH, Sougrat R, Lindwasser OW, Olenych S, Bonifacino JS, Davidson MW, Lippincott-Schwartz J, Hess HF. Imaging Intracellular Fluorescent Proteins at Nanometer Resolution. Science. 2006;313:1642–1645. - PubMed

Publication types

MeSH terms

LinkOut - more resources