. 2013 Aug 29:13:122.
doi: 10.1186/1471-2229-13-122.

P-TRAP: a Panicle TRAit Phenotyping tool

Affiliations

P-TRAP: a Panicle TRAit Phenotyping tool

Faroq A L-Tam et al. BMC Plant Biol. .

Abstract

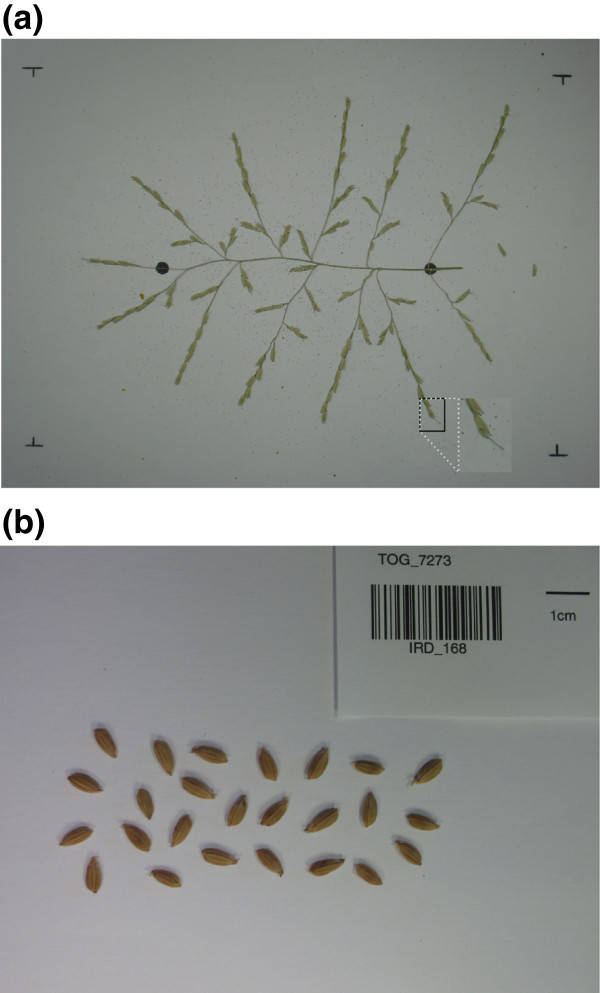
Background: In crops, inflorescence complexity and the shape and size of the seed are among the most important characters that influence yield. For example, rice panicles vary considerably in the number and order of branches, elongation of the axis, and the shape and size of the seed. Manual low-throughput phenotyping methods are time consuming, and the results are unreliable. However, high-throughput image analysis of the qualitative and quantitative traits of rice panicles is essential for understanding the diversity of the panicle as well as for breeding programs.

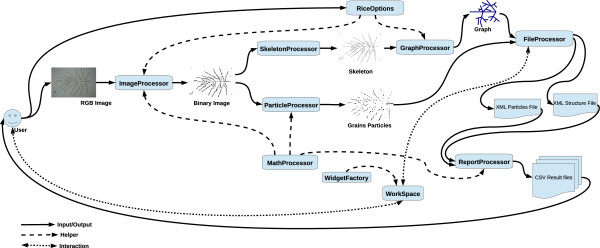
Results: This paper presents P-TRAP software (Panicle TRAit Phenotyping), a free open source application for high-throughput measurements of panicle architecture and seed-related traits. The software is written in Java and can be used with different platforms (the user-friendly Graphical User Interface (GUI) uses Netbeans Platform 7.3). The application offers three main tools: a tool for the analysis of panicle structure, a spikelet/grain counting tool, and a tool for the analysis of seed shape. The three tools can be used independently or simultaneously for analysis of the same image. Results are then reported in the Extensible Markup Language (XML) and Comma Separated Values (CSV) file formats. Images of rice panicles were used to evaluate the efficiency and robustness of the software. Compared to data obtained by manual processing, P-TRAP produced reliable results in a much shorter time. In addition, manual processing is not repeatable because dry panicles are vulnerable to damage. The software is very useful, practical and collects much more data than human operators.

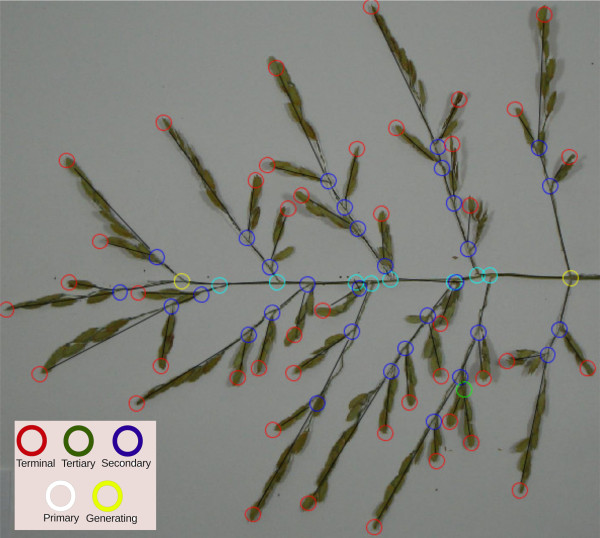
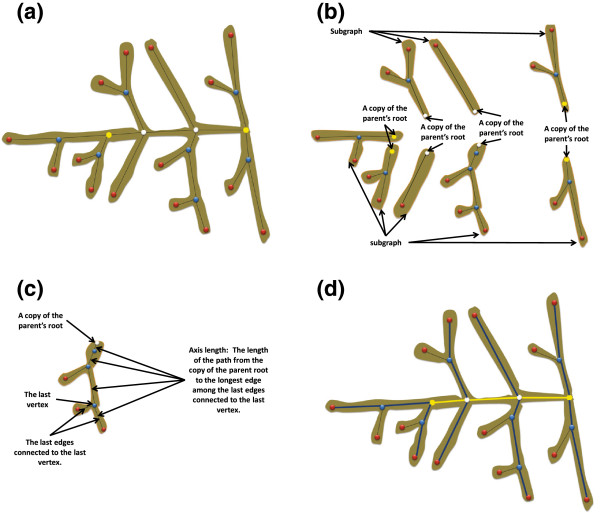
Conclusions: P-TRAP is a new open source software that automatically recognizes the structure of a panicle and the seeds on the panicle in numeric images. The software processes and quantifies several traits related to panicle structure, detects and counts the grains, and measures their shape parameters. In short, P-TRAP offers both efficient results and a user-friendly environment for experiments. The experimental results showed very good accuracy compared to field operator, expert verification and well-known academic methods.


Figures

Figure 1
Figure 1
Structure of a rice panicle. Schematic representation of a rice panicle comprising a main central axis (blue line) named rachis, to which primary branches (Pb) are attached (black lines); the primary branches bear secondary branches (Sb, green lines), which in turn bear tertiary branches (Tb, orange lines). Spikelets (Sp) are attached to the branches by a peduncle. Nodes are represented by red dots (ARM, Aborted Rachis Meristem). In the P-TRAP output results, the following terms are used instead of botanical terminology: Primary Axis (PA) for the blue line, the secondary axes (SA) for the black lines; the tertiary axes (TA) for the green lines and the quaternary axes (QA) for the orange lines.
Figure 2
Figure 2
Panicle and seed image preparation.(a) The panicle is spread out on a white background and held in place by metal pins, the two black marks are the positions of the start and end of the panicle rachis. This type of image is used for panicle structure, spikelet/grain counting and seed trait analyses. (b) Seeds spread out for the analysis of seed traits.
Figure 3
Figure 3
A panicle graph superimposed on a panicle image. The circles represent the junctions and the termination of the branches. The use of colors makes it easy for users to distinguish between different types of branches (see the inset for definitions of the colors of the circles).
Figure 4
Figure 4
Graph decomposition and vertex classification.(a) original graph, (b) decomposing the graph at the start generating vertex (root), (c) classifying the neighbors of the start generating vertex, (d) decomposing the maximum weighed sub-graph at its root vertex, (e) classifying the vertices of the neighboring sub-graph root, (f) unclassified vertex in a small sub-graph, (g) decomposing and classifying the unclassified vertex in (f), and (h) in a fully classified graph.
Figure 5
Figure 5
Quantification of classified graphs.(a) a classified graph, (b) decomposing the classified graph and adding a copy of the parent root to the sub-graphs, (c) calculating the length of an axis, and (d) yellow line: the rachis length (PA_length), blue lines: the lengths of the SA in the graph.
Figure 6
Figure 6
Grain counting pipeline.(a) a binary image, (b) the image after applying the 1st mathematical opening with disk size d^1, (c) the image after the 2nd mathematical opening with disk size d^2, and (d) results: small white circles represent the concave points.
Figure 7
Figure 7
P-TRAP architecture and the processing pipeline. The input images and the software options are provided by the user. These images are then binarized and passed to the graph and particle processing modules to identify the structure and the grains on the panicle. The resulting graphs and particles are stored in separate XML files for visualization and additional editing. These editors are part of the Workspace module, which translates the XML files into editable widgets supported by the WidgetFactory GUI helper module. The user can easily edit these visual widgets and send the changes back to the XML files for storage. All interactions between the user and the system are performed using the Workspace module. The final reports are based on the contents of the XML files. The contents of these reports are stored in CSV files with different levels of detail.
Figure 8
Figure 8
Main GUI window areas.Project Manager: the user can manipulate the project folders and their files; Commands: the user can run a specific process on the selected project; Workspace: the user can visualize and edit the selected widgets.

References

    1. Yoshida H, Nagato Y. Flower development in rice. J Exper Botany. 2011;62(14):4719–4730. doi: 10.1093/jxb/err272. - DOI - PubMed
    1. Xing Q. Y & Zhang. Genetic and molecular bases of rice yield. Ann Rev Plant Biol. 2010;61:421–442. doi: 10.1146/annurev-arplant-042809-112209. - DOI - PubMed
    1. Wang Y, Li J. Branching in rice. Curr Opin Plant Biol. 2011;14:94–99. doi: 10.1016/j.pbi.2010.11.002. - DOI - PubMed
    1. Vaughan DA, Morishima H, Kadowaki K. Diversity in the Oryza genus. Curr Opin Plant Biol. 2003;6(2):139–146. doi: 10.1016/S1369-5266(03)00009-8. - DOI - PubMed
    1. Reuzeau C, Pen J, Frankard V, de Wolf J, Peerbolte R, Broekaert W, van Camp W. TraitMill: a discovery engine for identifying yield-enhancement genes in cereals. Mol Plant Breed. 2005;3(5):753–759.

Publication types