. 2013;3(5):536-45.
doi: 10.1089/brain.2013.0163. Epub 2013 Sep 26.

Temporal-order judgment of audiovisual events involves network activity between parietal and prefrontal cortices

Affiliations

Temporal-order judgment of audiovisual events involves network activity between parietal and prefrontal cortices

Bhim Mani Adhikari et al. Brain Connect. 2013.

Abstract

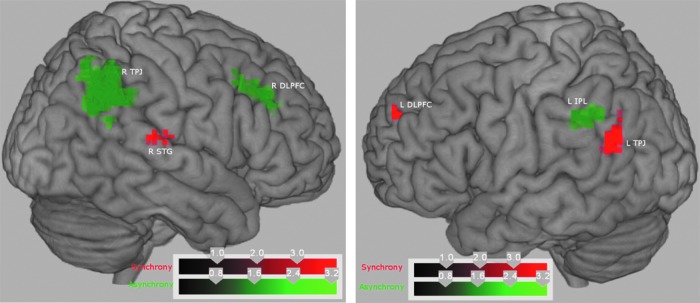
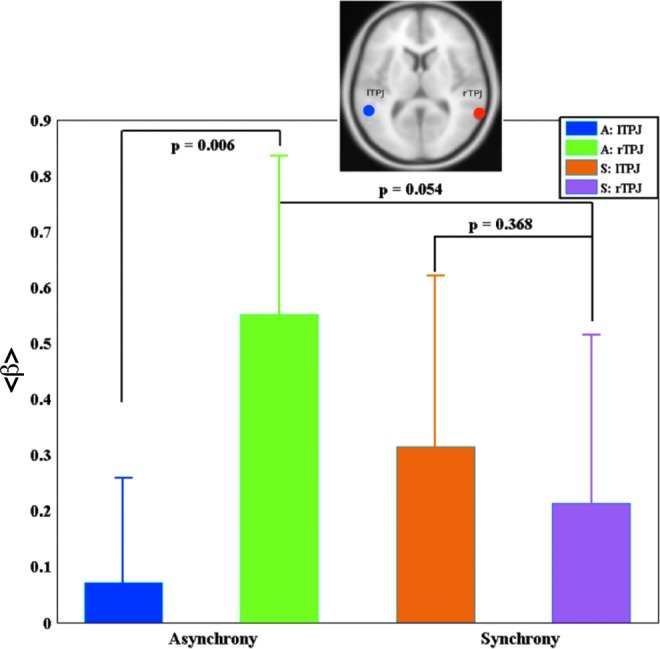
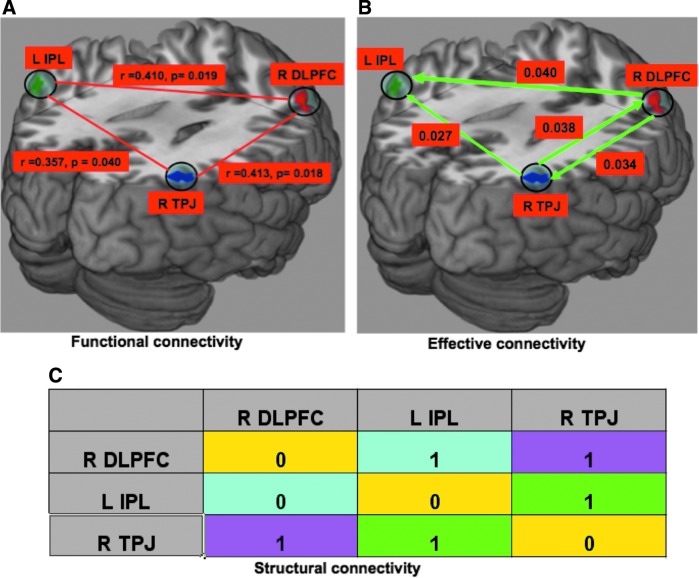
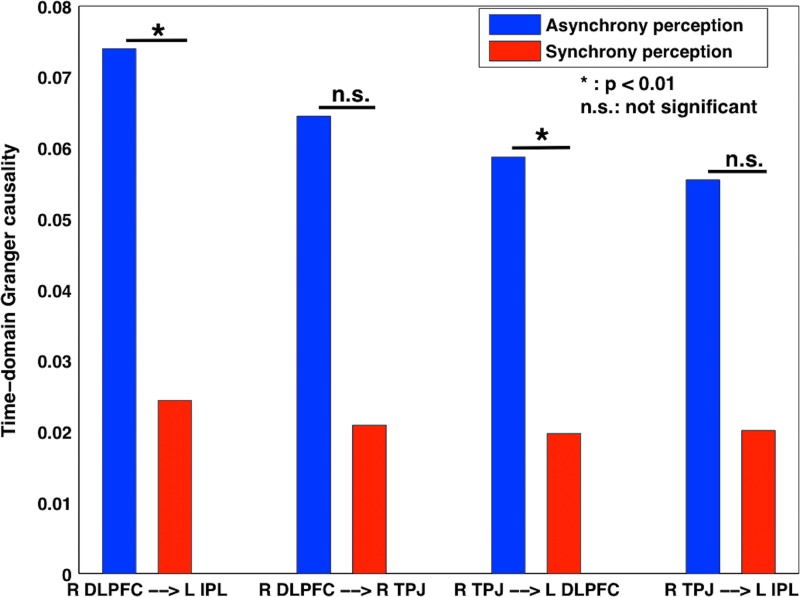
Our perception of the temporal order of everyday external events depends on the integrated sensory information in the brain. Our understanding of the brain mechanism for temporal-order judgment (TOJ) of unisensory events, particularly in the visual domain, is advanced. In case of multisensory events, however, there are unanswered questions. Here, by using physically synchronous and asynchronous auditory-visual events in functional magnetic resonance imaging (fMRI) experiments, we identified the brain network that is associated with the perception of the temporal order of multisensory events. The activation in the right temporo-parietal junction was modulated by the perception of asynchronous audiovisual events. During this perception of temporal order, the right dorsolateral prefrontal cortex coordinated activity with the right temporo-parietal and the left inferior parietal cortices. These results suggest that the TOJ in the multisensory domain underlies a network activity between parietal and prefrontal cortices unlike the regional activity in the right temporo-parietal junction in the unisensory visual domain.


Figures

FIG. 1.
FIG. 1.
Experimental design and results from behavioral experiment. The two independent variables, stimulus onset asynchrony and frequency, are represented here as Δt and f. The black lines represent the synchrony percept, while the blue and red lines represent the video-preceding-audio and audio-preceding-video percepts, respectively. The green line represents the drift percept, in which participants reported the two stimuli moving in or out of synchrony.
FIG. 2.
FIG. 2.
Activations related to auditory leading visual (AV) asynchrony perceptions cluster-based family wise error correction (p<0.05). Areas: temporal parietal junction [TPJ includes right superior temporal gyrus, inferior parietal lobe (IPL) and supramarginal gyrus], medial frontal gyrus (left MeFG), dorsolateral prefrontal cortex (DLPFC includes right middle frontal gyrus, BA 9), and IPL (left IPL). The color intensity represents t-statistics, and the activations are overlaid on the Montreal Neurological Institute structural template brain in neurological orientation.
FIG. 3.
FIG. 3.
Brain renderings displaying the z-scores of clusters of functional magnetic resonance imaging voxels more significantly activated by audiovisual asynchrony perception>rest (green) and synchrony perception>rest (red). Left, Sagittal rendering of the right hemisphere. Right, Sagittal rendering of the left hemisphere.
FIG. 4.
FIG. 4.
Mean contrast values: Contrast values were calculated for both asynchrony (A) and synchrony (S) perceptions from right temporal parietal junction (rTPJ) and left temporal parietal junction (lTPJ) regions of interest (ROIs are shown atop) from each subject and were used to calculate mean beta and the standard error of the mean.
FIG. 5.
FIG. 5.
Connectivity analysis: (A) Functional connectivity, (B) Directed functional connectivity during audiovisual asynchrony perception by nonparametric Granger causality technique, (C) Structural connectivity based on CoCoMac database (Ghosh et al., ; Kotter and Wanke, ; Stephan et al., 2000) (“0” means there is no structural connection whereas “1” means there is). Here, r represents the correlation coefficient and p represents significance p-value, the probability of observing the given result by chance if the null hypothesis is true. These three regions are functionally connected (cross-correlation analysis) as shown in plot (A). IPL received the strong causal influences from both TPJ and DLPFC, whereas there was bidirectional causal interaction between them, as shown in plot (B).
FIG. 6.
FIG. 6.
Directed connectivity in audiovisual asynchrony and synchrony. The causal influences from R DLPFC to L IPL and R TPJ to L DLPFC were significantly greater for asynchrony perception.

References

    1. Ashburner J. Friston KJ. Nonlinear spatial normalization using basis funcitons. Hum Brain Mapp. 1999;7:254–266. - PMC - PubMed
    1. Assmus A. Marshall JC. Noth J. Zilles K. Fink GR. Difficulty of perceptual spatiotemporal integration modulates the neural activity of left inferior parietal cortex. Neuroscience. 2005;132:923–927. - PubMed
    1. Assmus A. Marshall JC. Ritzl A. Noth J. Zilles K. Fink GR. Left inferior parietal cortex integrates time and space during collision judgments. Neuroimage. 2003;20:S82–S88. - PubMed
    1. Battelli L. Cavanagh P. Martini P. Bartyon JJ. Bilateral deficits of transient visual attention in right parietal patients. Brain. 2003;126:2164–2176. - PubMed
    1. Battelli L. Pascual-Leone A. Cavanagh P. The ‘when’ pathway of the right parietal lobe. Trends Cogn Sci. 2007;11:204–210. - PMC - PubMed

Publication types