

Animal versus human oral drug bioavailability: do they correlate?
- PMID: 23988844
- PMCID: PMC4107270
- DOI: 10.1016/j.ejps.2013.08.018
Animal versus human oral drug bioavailability: do they correlate?
Abstract
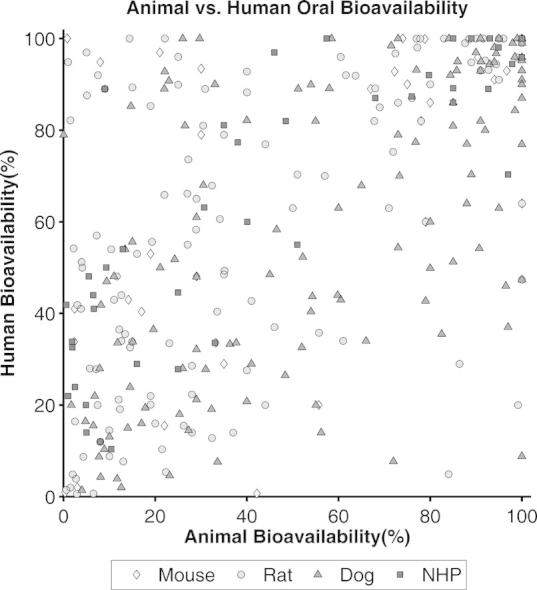
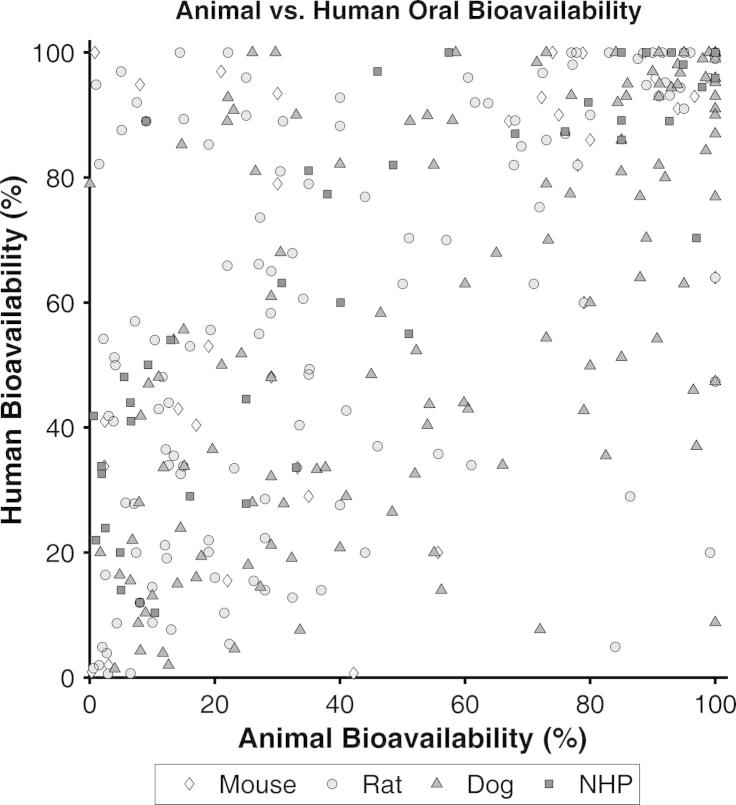
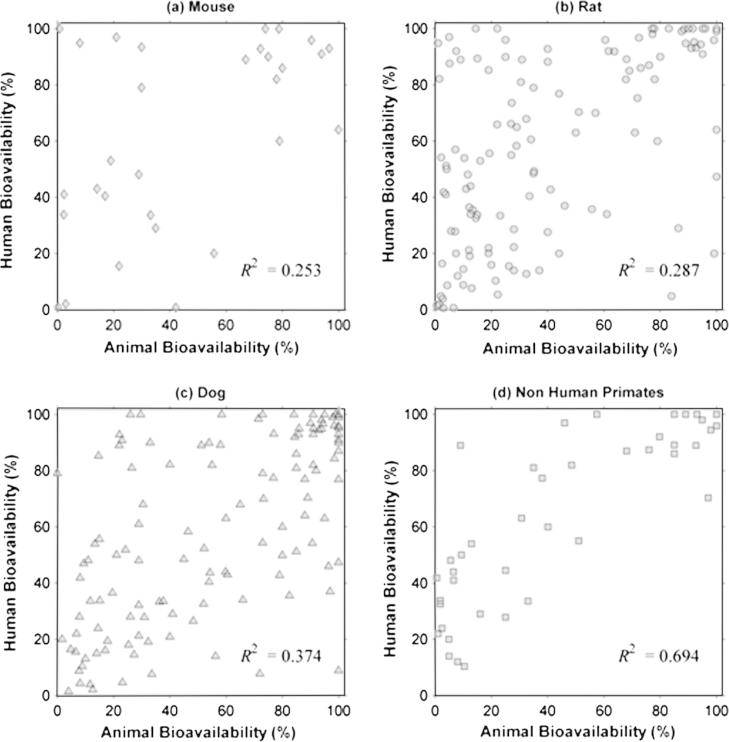
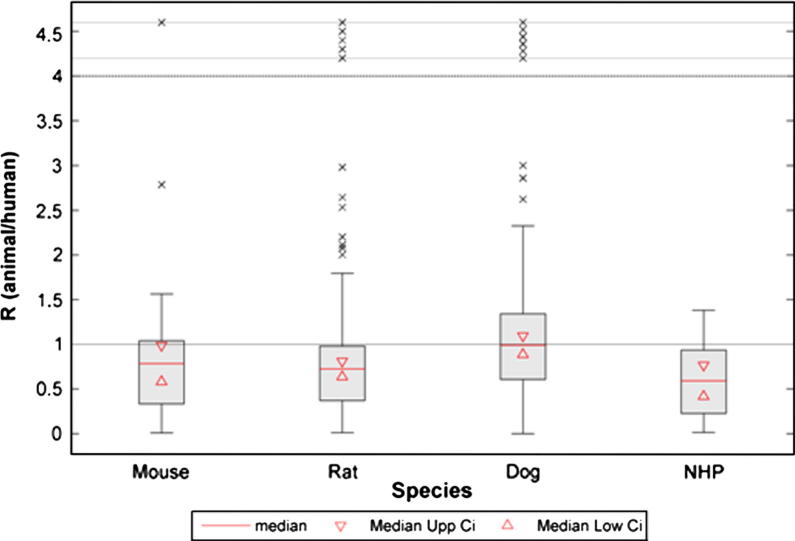
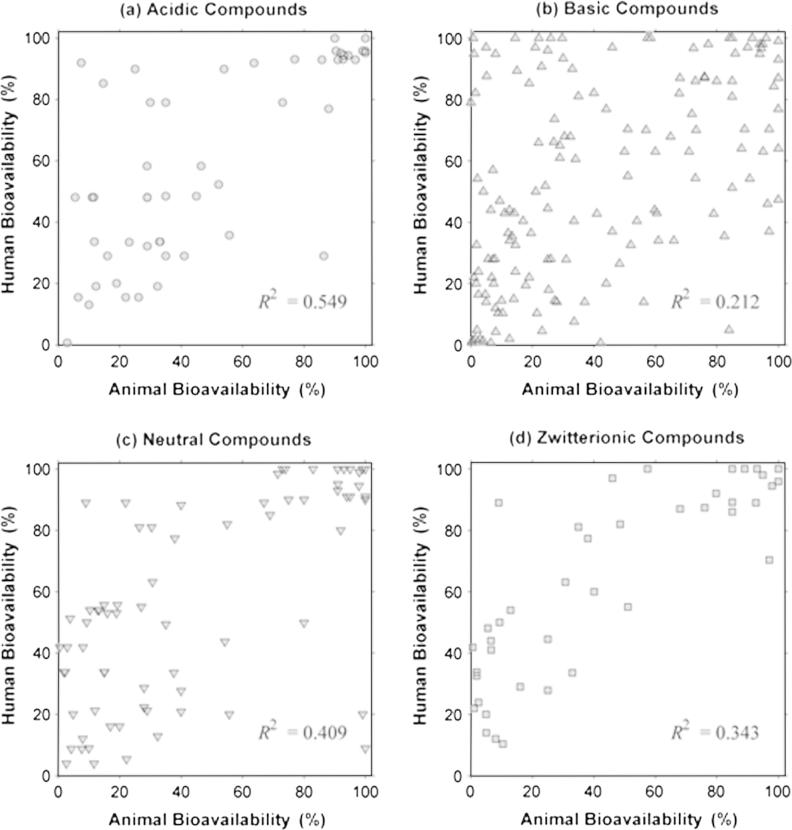
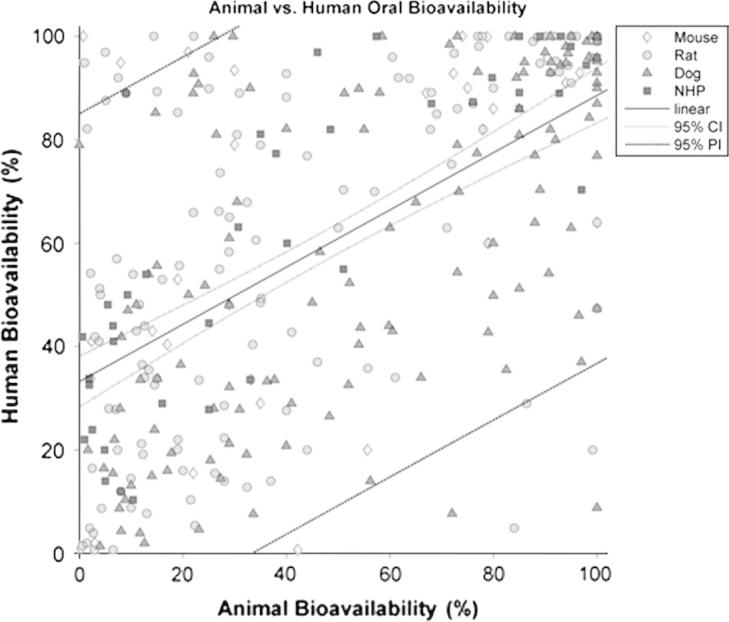
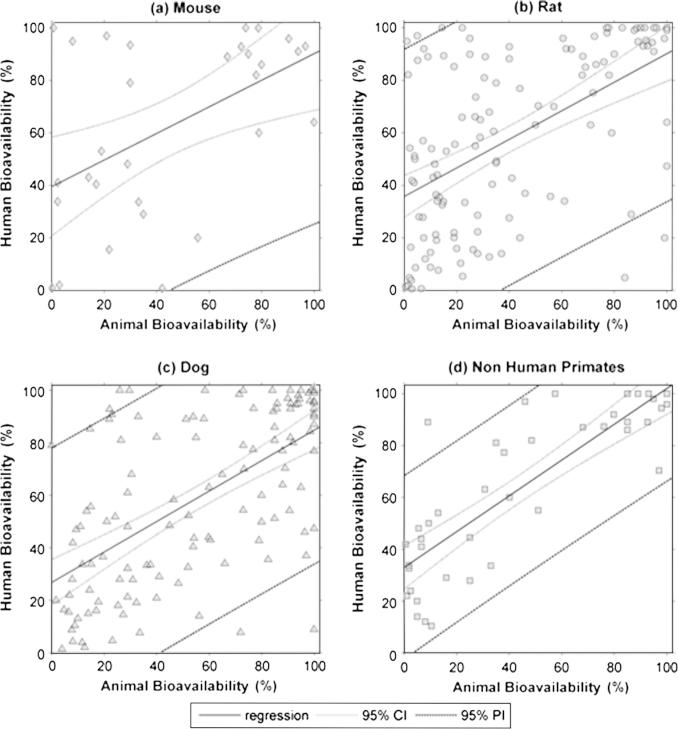
Oral bioavailability is a key consideration in development of drug products, and the use of preclinical species in predicting bioavailability in human has long been debated. In order to clarify whether any correlation between human and animal bioavailability exist, an extensive analysis of the published literature data was conducted. Due to the complex nature of bioavailability calculations inclusion criteria were applied to ensure integrity of the data. A database of 184 compounds was assembled. Linear regression for the reported compounds indicated no strong or predictive correlations to human data for all species, individually and combined. The lack of correlation in this extended dataset highlights that animal bioavailability is not quantitatively predictive of bioavailability in human. Although qualitative (high/low bioavailability) indications might be possible, models taking into account species-specific factors that may affect bioavailability are recommended for developing quantitative prediction.
Keywords: Drug development; First in man pharmacokinetics; Oral drug absorption.
Copyright © 2013 Elsevier B.V. All rights reserved.
Figures
References
-
- Akabane T., Tabata K., Kadono K., Sakuda S., Terashita S., Teramura T. A comparison of pharmacokinetics between humans and monkeys. Drug Metab. Dispos. 2010;38:308–316. - PubMed
-
- Cao X., Gibbs S.T., Fang L., Miller H.A., Landowski C.P., Shin H.C., Lennernas H., Zhong Y., Amidon G.L., Yu L.X., Sun D. Why is it challenging to predict intestinal drug absorption and oral bioavailability in human using rat model. Pharm. Res. 2006;23:1675–1686. - PubMed
-
- Chiou W.L., Barve A. Linear correlation of the fraction of oral dose absorbed of 64 drugs between humans and rats. Pharm. Res. 1998;15:1792–1795. - PubMed
-
- Chiou W.L., Buehler P.W. Comparison of oral absorption and bioavailability of drugs between monkey and human. Pharm. Res. 2002;19:868–874. - PubMed
-
- Chiou W.L., Jeong H.Y., Chung S.M., Wu T.C. Evaluation of using dog as an animal model to study the fraction of oral dose absorbed of 43 drugs in humans. Pharm. Res. 2000;17:135–140. - PubMed
Publication types
MeSH terms
Substances
LinkOut - more resources
Full Text Sources
Other Literature Sources
Medical
