. 2013 Oct 15;305(8):G573-84.
doi: 10.1152/ajpgi.00071.2013. Epub 2013 Aug 29.

Irgm1-deficient mice exhibit Paneth cell abnormalities and increased susceptibility to acute intestinal inflammation

Affiliations

Irgm1-deficient mice exhibit Paneth cell abnormalities and increased susceptibility to acute intestinal inflammation

Bo Liu et al. Am J Physiol Gastrointest Liver Physiol. .

Abstract

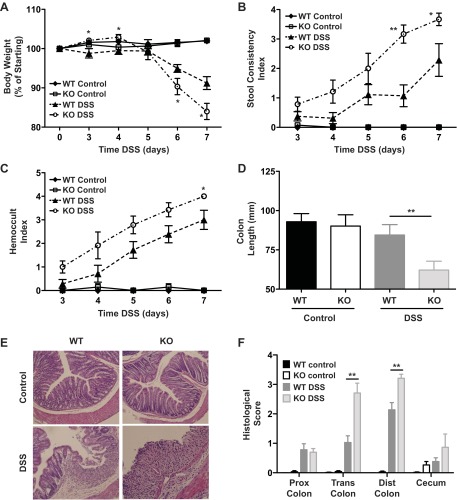
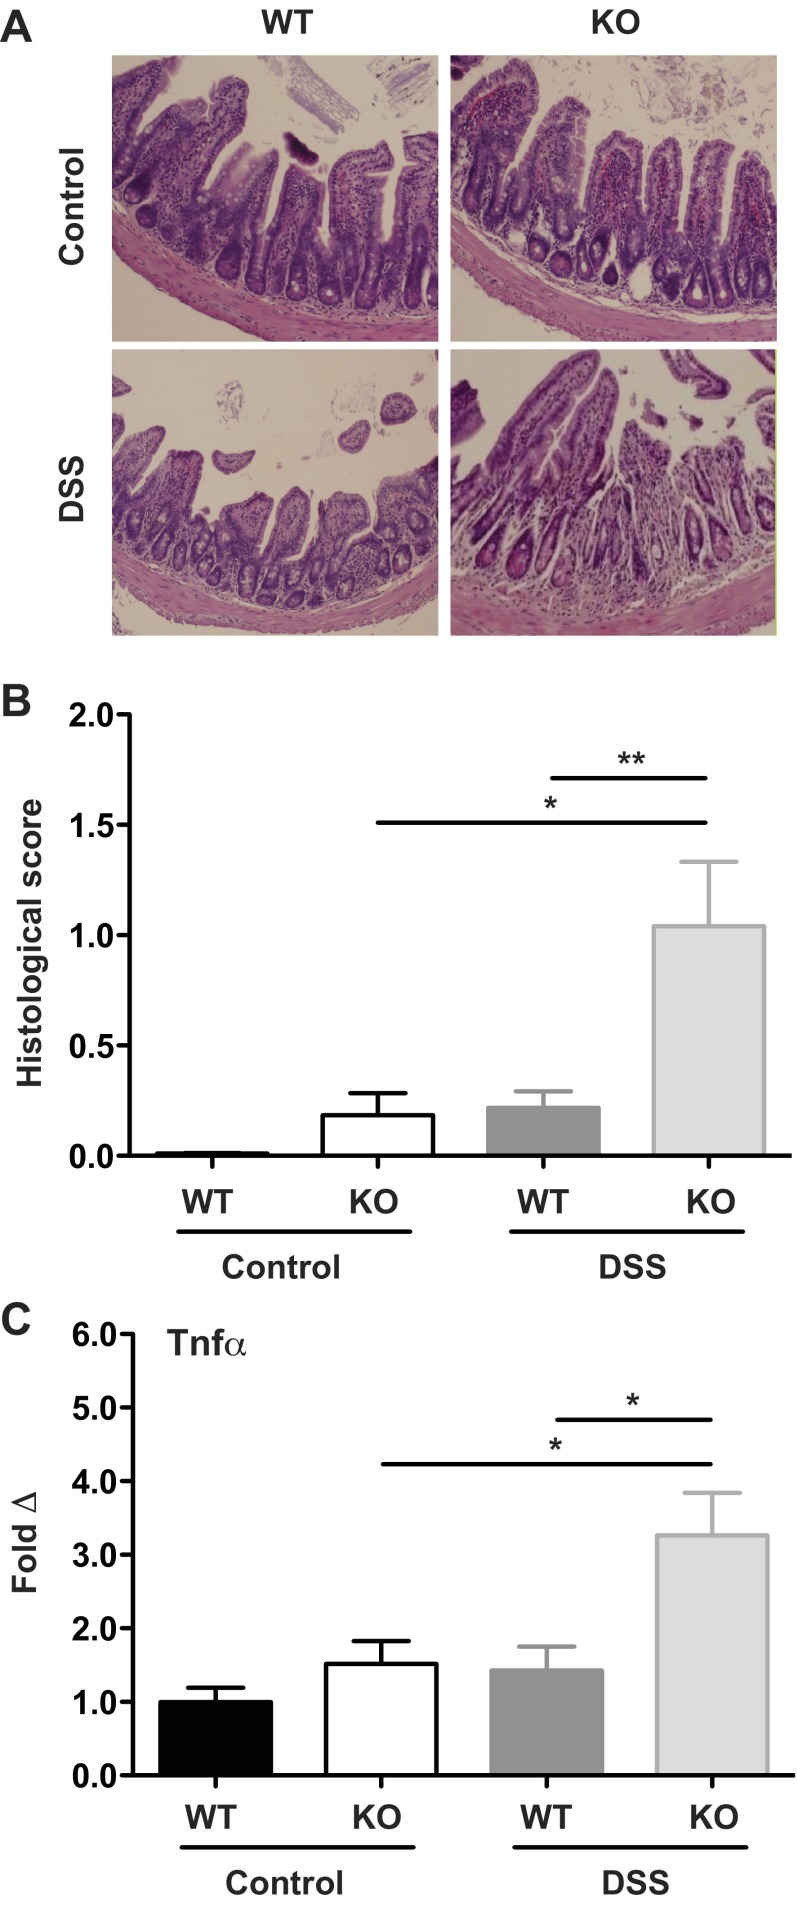
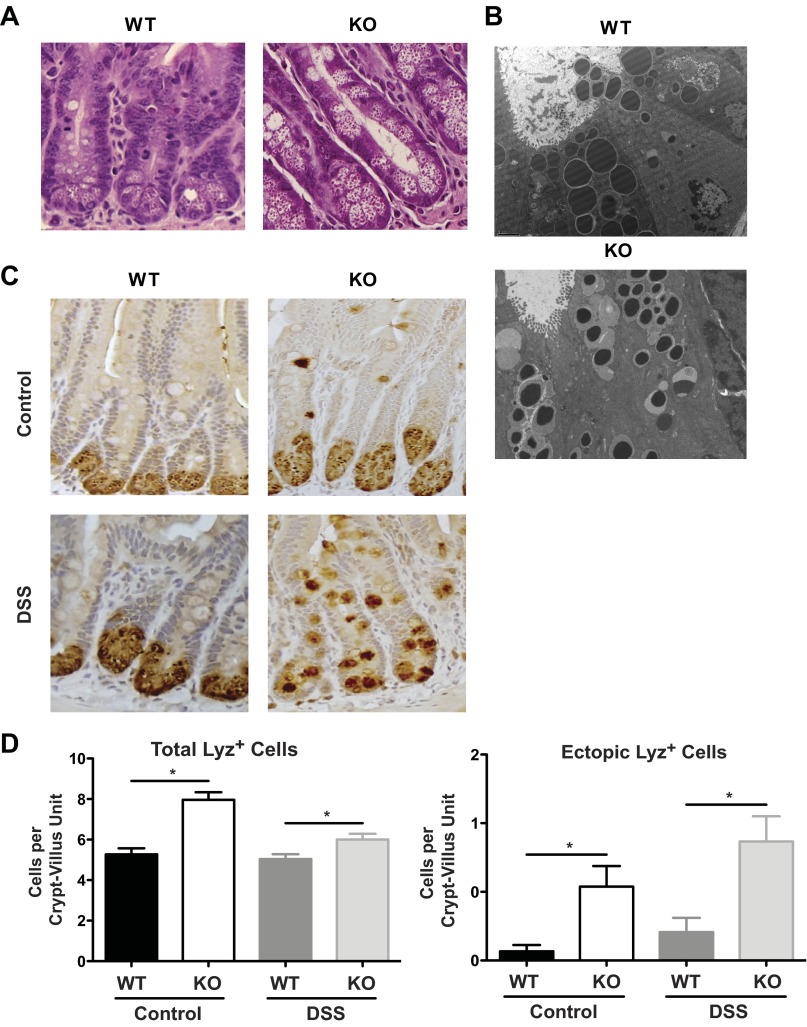
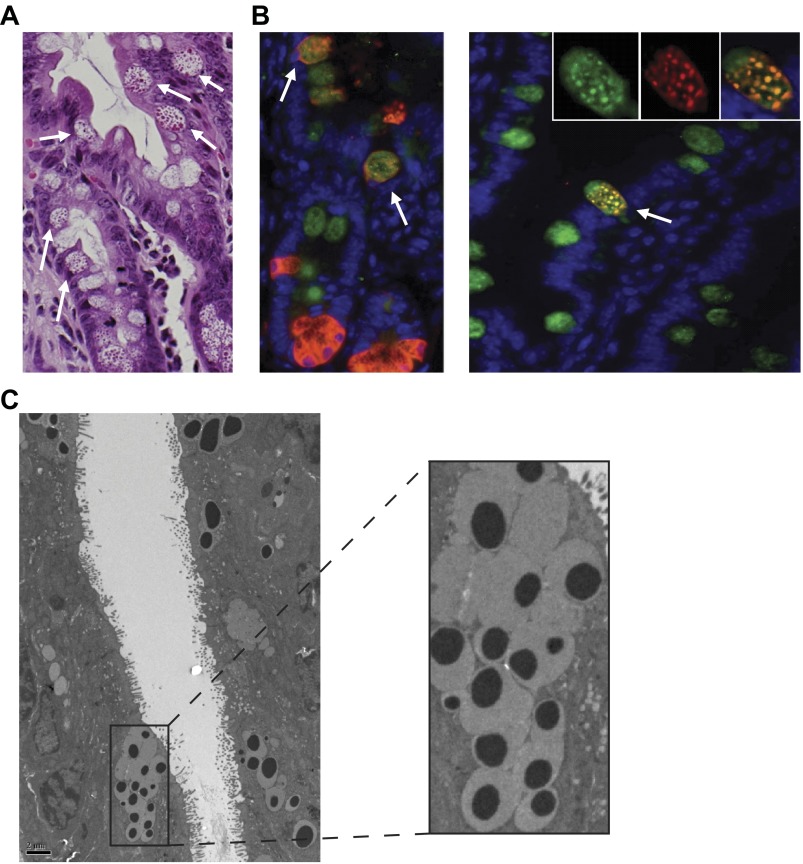
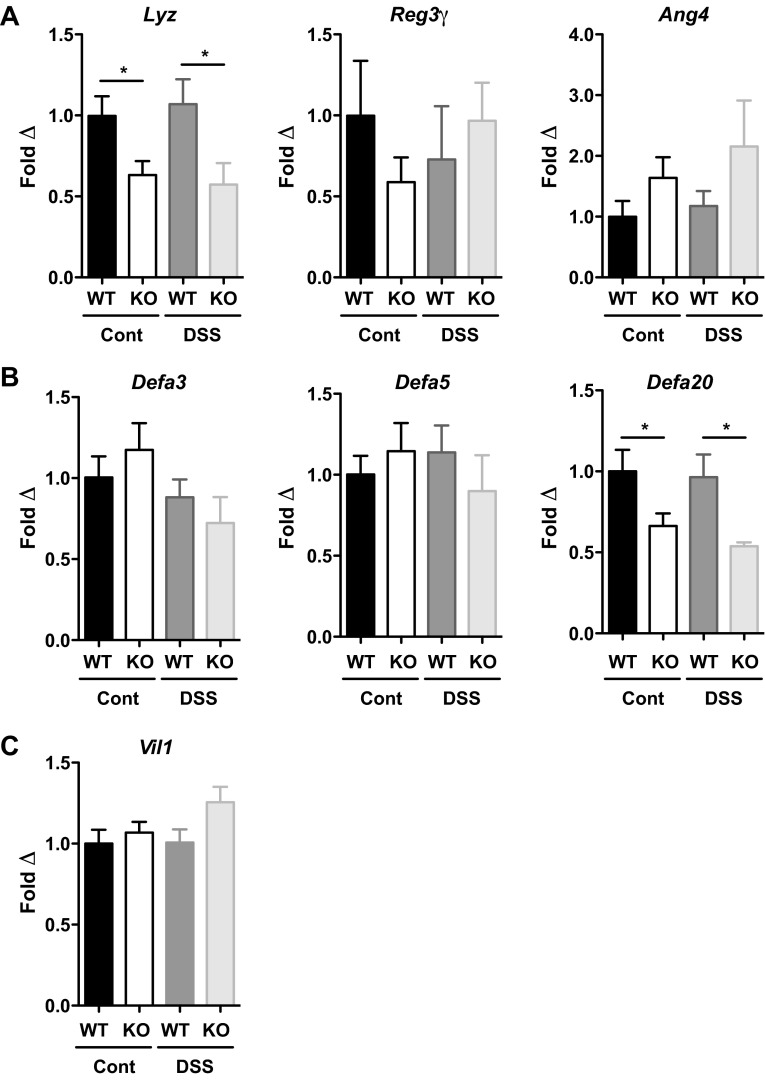
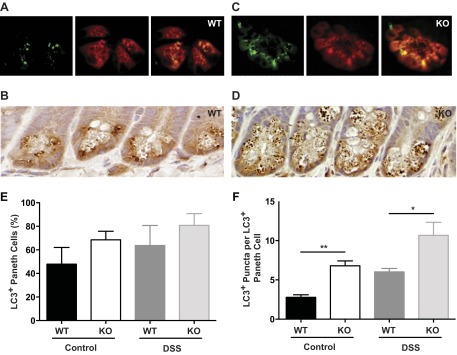
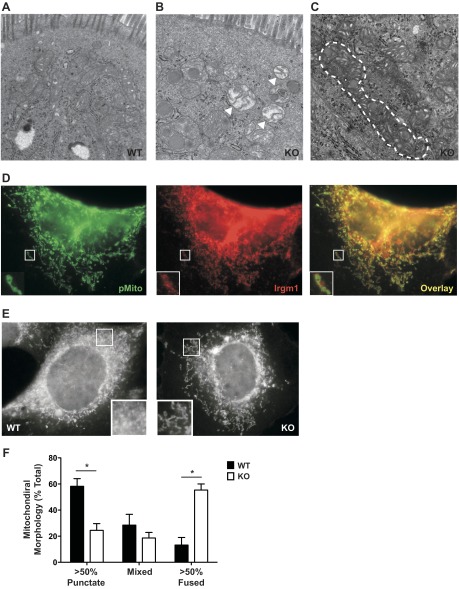
Crohn's disease (CD) is a chronic, immune-mediated, inflammatory disorder of the intestine that has been linked to numerous susceptibility genes, including the immunity-related GTPase (IRG) M (IRGM). IRGs comprise a family of proteins known to confer resistance to intracellular infections through various mechanisms, including regulation of phagosome processing, cell motility, and autophagy. However, despite its association with CD, the role of IRGM and other IRGs in regulating intestinal inflammation is unclear. We investigated the involvement of Irgm1, an ortholog of IRGM, in the genesis of murine intestinal inflammation. After dextran sodium sulfate exposure, Irgm1-deficient [Irgm1 knockout (KO)] mice showed increased acute inflammation in the colon and ileum, with worsened clinical responses. Marked alterations of Paneth cell location and granule morphology were present in Irgm1 KO mice, even without dextran sodium sulfate exposure, and were associated with impaired mitophagy and autophagy in Irgm1 KO intestinal cells (including Paneth cells). This was manifested by frequent tubular and swollen mitochondria and increased LC3-positive autophagic structures. Interestingly, these LC3-positive structures often contained Paneth cell granules. These results suggest that Irgm1 modulates acute inflammatory responses in the mouse intestine, putatively through the regulation of gut autophagic processes, that may be pivotal for proper Paneth cell functioning.

Keywords: autophagy; experimental colitis; immunity-related GTPases.


Figures

Fig. 1.
Fig. 1.
Enhanced colonic inflammation in immunity-related GTPase (Irg) M (Irgm)-deficient (Irgm1 KO) mice receiving dextran sodium sulfate (DSS). Male wild-type (WT) and Irgm1 KO mice were given 3% DSS in drinking water (DSS) or maintained on standard drinking water (control) for 7 days. A–C: clinical indicators of inflammation [average body weight, average stool consistency score, and average bleeding (Hemoccult) index] at days 0–7. D: average colon length at necropsy. E: representative histological tissue sections from transverse colon (hematoxylin-eosin stain; ×100 magnification). F: average histological scores from proximal (Prox), transverse (Trans), and distal (Dist) colon and cecum. Values are means ± SE; data were combined from 3 separate studies. Combined cohort sizes were as follows: n = 9 WT control and WT DSS and 7 KO control and KO DSS. *P < 0.05, **P < 0.005 (KO DSS vs. WT DSS).
Fig. 2.
Fig. 2.
Enhanced ileal inflammation in Irgm1 KO mice receiving DSS. Male WT and Irgm1 KO mice were given 3% DSS in drinking water (DSS) or maintained on standard drinking water (control) for 7 days. A: representative histological tissue sections from ileum of WT control, WT DSS, KO control, and KO DSS mice (hematoxylin-eosin stain, ×100 magnification). B: average histological scores from ileum. C: results of quantitative RT-PCR measurement of ileal tissue TNF-α transcript levels in DSS-treated and control mice, normalized to Gapdh and expressed as fold change relative to WT control group. Values are means ± SE; data were combined from ≥3 experiments. For A and B, combined cohort sizes were as follows: n = 9 WT control and WT DSS and 7 KO control and KO DSS; for C, combined cohort sizes were n = 13 WT control, 11 KO control, 10 WT DSS, and 9 KO DSS. *P < 0.02, **P < 0.006.
Fig. 3.
Fig. 3.
Paneth cell abnormalities in Irgm1 KO mice. A and B: histological staining with hematoxylin and eosin (A; ×400 magnification) and transmission electron microscopy (B; ×5,000 magnification) of ileal tissues from untreated WT and Irgm1 KO mice. C: lysozyme (Lyz) immunohistochemical staining of ileal tissue from control and DSS-treated WT and KO mice (×200 magnification). D: total number of lysozyme (Lyz)-positive cells (left) and Lyz-positive cells above the base of the crypt (ectopic, right). Values are means ± SE; data were collected from 3 individual mice for each group, with ≥10 crypt-villus units per mouse. *P < 0.05.
Fig. 4.
Fig. 4.
Overproduction and ectopic placement of ileal intermediate cells in Irgm1 KO mice. Ileal tissue from Irgm1 KO mice was processed for hematoxylin-and-eosin staining (A; ×600 magnification), immunofluorescence staining with anti-Muc2 (green) and anti-Lyz (red) antibodies (B; ×600 magnification), and transmission electron microscopy [C; ×2,500 (left) and ×7,500 (right) magnification]. All modalities show numerous intermediate cells with properties of both goblet and Paneth cells (white arrows).
Fig. 5.
Fig. 5.
Altered antimicrobial peptide production in Irgm1 KO mice. Male WT and Irgm1 KO mice were given 3% DSS in drinking water (DSS) or maintained on standard drinking water (cont) for 7 days. Quantitative RT-PCR was used to measure transcript levels of selected molecules from several mouse antimicrobial peptide classes, including Lyz, Reg3γ, and Ang4 (A), representative α-defensin isoforms, including Defa3, Defa5, and Defa20 (B), and villin (Vil1, C), as an indicator of total epithelial cell mass. Values (means ± SE) are normalized to β-actin and expressed as fold change relative to the WT control group. Cohort sizes were as follows: n = 13 WT control, 11 KO control, 10 WT DSS, and 9 KO DSS. *P ≤ 0.05.
Fig. 6.
Fig. 6.
Altered autophagy in Irgm1 KO intestinal cells. Ileal tissue from untreated WT and Irgm1 KO mice was processed for immunofluorescence staining with anti-LC3 (green) and anti-Lyz (red) antibodies (A and C) or immunohistochemical staining with anti-LC3 (brown) followed by hematoxylin counterstain (purple; B and D). Images are representative of 8 mice examined per genotype. Magnification ×400. Quantitative analyses from control and DSS-treated WT and Irgm1 KO mice include average percentage of Paneth cells that were LC3-positive (E; 5 mice analyzed per genotype, with 150 cells examined per mouse) and total LC3-positive punctae per LC3-positive Paneth cell (F; 4 mice analyzed per genotype, with 40 LC3-positive cells examined per mouse, counted on ≥15 crypts per section). Values are means ± SE. *P < 0.05, **P < 0.001.
Fig. 7.
Fig. 7.
Altered mitophagy in Irgm1 KO cells. A–C: representative transmission electron micrographs from WT mouse ileal enterocytes (A), Irgm1 KO ileal enterocytes (B), and Irgm1 KO goblet cells (C). Magnification ×20,000. Note swollen mitochondria (arrowheads) and tubular mitochondria (outlined with dashed line) in Irgm1 KO cells in B and C, respectively. These phenotypes were seen in multiple Irgm1 KO enterocytes and goblet and Paneth cells and were not cell-specific. D: representative WT mouse embryonic fibroblasts transfected with pMito to label mitochondria, exposed to IFN-γ for 24 h, and then processed for staining with anti-Irgm1 antibodies. Magnification ×1,000. E: representative WT and Irgm1 KO mouse embryonic fibroblasts exposed to IFN-γ for 24 h, stained with Mito Tracker Red to label mitochondria, and then imaged. Magnification ×1,000. F: quantified punctate, tubular, or mixed mitochondrial morphologies assessed blindly from >50 cells per treatment group per experiment, with the averages of 4 experiments shown. Values are means ± SE. *P < 0.05.
Fig. 8.
Fig. 8.
Transcript expression of selected genes altered in Atg16L1HM mice. Atg16L1-deficient Paneth cells have been shown to exhibit increased expression of genes involved in peroxisome proliferator-activated receptor (PPAR) pathways, adipocytokine signaling, lipid metabolism, and acute-phase reactant responses. Ileal mRNA expression of specific transcripts enriched in Atg16L1-deficient Paneth cells, relevant to these pathways, was evaluated in untreated WT and Irgm1 KO mice by quantitative RT-PCR. A: stearoyl-coenzyme A desaturase 1 (Scd1), involved in lipid metabolism. B: adiponectin (Adipoq), involved in adipocytokine signaling. C: serum amyloid A1 (Saa1), involved in acute-phase reactant response. D: leptin (Lep), involved in adipocytokine signaling and the PPAR pathway. Values are means ± SE; n = 9 WT and KO. No significant differences were observed for any of the transcripts tested (P > 0.2).

References

    1. Abraham C, Cho JH. Inflammatory bowel disease. N Engl J Med 361: 2066–2078, 2009 - PMC - PubMed
    1. Ayabe T, Satchell DP, Wilson CL, Parks WC, Selsted ME, Ouellette AJ. Secretion of microbicidal α-defensins by intestinal Paneth cells in response to bacteria. Nat Immunol 1: 113–118, 2000 - PubMed
    1. Bafica A, Feng CG, Santiago HC, Aliberti J, Cheever A, Thomas KE, Taylor GA, Vogel SN, Sher A. The IFN-inducible GTPase LRG47 (Irgm1) negatively regulates TLR4-triggered proinflammatory cytokine production and prevents endotoxemia. J Immunol 179: 5514–5522, 2007 - PubMed
    1. Bekpen C, Hunn JP, Rohde C, Parvanova I, Guethlein L, Dunn DM, Glowalla E, Leptin M, Howard JC. The interferon-inducible p47 (IRG) GTPases in vertebrates: loss of the cell autonomous resistance mechanism in the human lineage. Genome Biol 6: R92, 2005 - PMC - PubMed
    1. Bevins CL, Salzman NH. Paneth cells, antimicrobial peptides and maintenance of intestinal homeostasis. Nat Rev Microbiol 9: 356–368, 2011 - PubMed

Publication types