Crystallization of the HigBA2 toxin-antitoxin complex from Vibrio cholerae
- PMID: 23989162
- PMCID: PMC3758162
- DOI: 10.1107/S1744309113021490
Crystallization of the HigBA2 toxin-antitoxin complex from Vibrio cholerae
Abstract
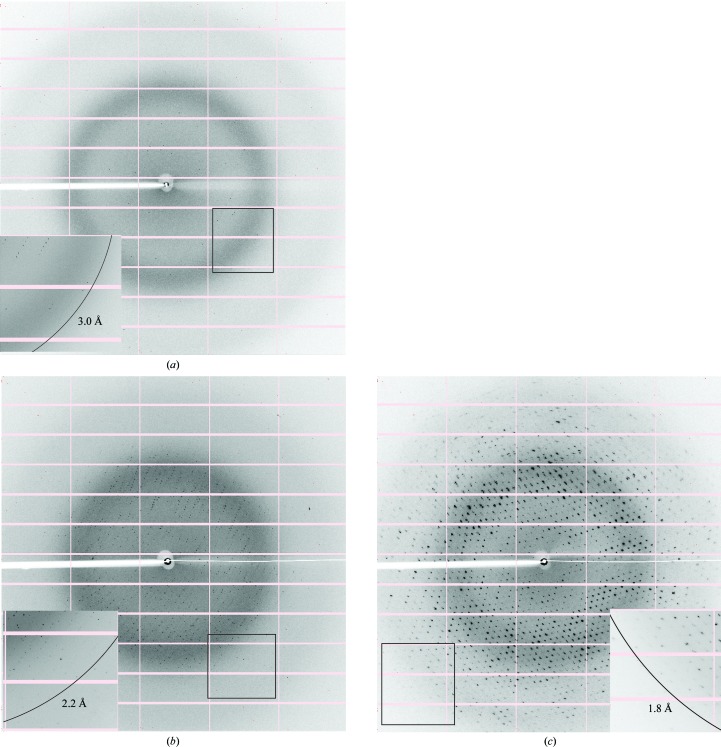
The genome of Vibrio cholerae encodes two higBA toxin-antitoxin (TA) modules that are activated by amino-acid starvation. Here, the TA complex of the second module, higBA2, as well as the C-terminal domain of the corresponding HigA2 antitoxin, have been purified and crystallized. The HigBA2 complex crystallized in two crystal forms. Crystals of form I belonged to space group P2(1)2(1)2, with unit-cell parameters a = 129.0, b = 119.8, c = 33.4 Å, and diffracted to 3.0 Å resolution. The asymmetric unit is likely to contain a single complex consisting of two toxin monomers and one antitoxin dimer. The second crystal form crystallized in space group P3(2)21, with unit-cell parameters a = 134.5, c = 55.4 Å. These crystals diffracted to 2.2 Å resolution and probably contain a complex with a different stoichiometry. Crystals of the C-terminal domain of HigA2 belonged to space group C2, with unit-cell parameters a = 115.4, b = 61.2, c = 73.8 Å, β = 106.7°, and diffracted to 1.8 Å resolution.
Keywords: intrinsic disorder; macromolecular complexes; persistence; ribonucleases; toxin–antitoxin modules.
Figures

Similar articles
-
Crystallization of two operator complexes from the Vibrio cholerae HigBA2 toxin-antitoxin module.Acta Crystallogr F Struct Biol Commun. 2015 Feb;71(Pt 2):226-33. doi: 10.1107/S2053230X15000746. Epub 2015 Jan 28. Acta Crystallogr F Struct Biol Commun. 2015. PMID: 25664801 Free PMC article.
-
The Escherichia coli RnlA-RnlB toxin-antitoxin complex: production, characterization and crystallization.Acta Crystallogr F Struct Biol Commun. 2020 Jan 1;76(Pt 1):31-39. doi: 10.1107/S2053230X19017175. Epub 2020 Jan 1. Acta Crystallogr F Struct Biol Commun. 2020. PMID: 31929184 Free PMC article.
-
Crystallization of Doc and the Phd-Doc toxin-antitoxin complex.Acta Crystallogr Sect F Struct Biol Cryst Commun. 2008 Nov 1;64(Pt 11):1034-8. doi: 10.1107/S1744309108031722. Epub 2008 Oct 28. Acta Crystallogr Sect F Struct Biol Cryst Commun. 2008. PMID: 18997335 Free PMC article.
-
Molecular mechanism of acquisition of the cholera toxin genes.Indian J Med Res. 2011 Feb;133(2):195-200. Indian J Med Res. 2011. PMID: 21415494 Free PMC article. Review.
-
Functional characterization of toxin-antitoxin system in Mycobacterium tuberculosis.Indian J Tuberc. 2023 Apr;70(2):149-157. doi: 10.1016/j.ijtb.2022.05.010. Epub 2022 May 27. Indian J Tuberc. 2023. PMID: 37100570 Review.
Cited by
-
Fuzzy recognition by the prokaryotic transcription factor HigA2 from Vibrio cholerae.Nat Commun. 2024 Apr 10;15(1):3105. doi: 10.1038/s41467-024-47296-3. Nat Commun. 2024. PMID: 38600130 Free PMC article.
-
Induced DNA bending by unique dimerization of HigA antitoxin.IUCrJ. 2020 Jun 26;7(Pt 4):748-760. doi: 10.1107/S2052252520006466. eCollection 2020 Jul 1. IUCrJ. 2020. PMID: 32695421 Free PMC article.
-
Crystallization of two operator complexes from the Vibrio cholerae HigBA2 toxin-antitoxin module.Acta Crystallogr F Struct Biol Commun. 2015 Feb;71(Pt 2):226-33. doi: 10.1107/S2053230X15000746. Epub 2015 Jan 28. Acta Crystallogr F Struct Biol Commun. 2015. PMID: 25664801 Free PMC article.
-
Ribosome-dependent Vibrio cholerae mRNAse HigB2 is regulated by a β-strand sliding mechanism.Nucleic Acids Res. 2017 May 5;45(8):4972-4983. doi: 10.1093/nar/gkx138. Nucleic Acids Res. 2017. PMID: 28334932 Free PMC article.
-
Keeping the Wolves at Bay: Antitoxins of Prokaryotic Type II Toxin-Antitoxin Systems.Front Mol Biosci. 2016 Mar 22;3:9. doi: 10.3389/fmolb.2016.00009. eCollection 2016. Front Mol Biosci. 2016. PMID: 27047942 Free PMC article. Review.
References
Publication types
MeSH terms
Substances
LinkOut - more resources
Full Text Sources
Other Literature Sources
Molecular Biology Databases
Miscellaneous