Comparative Study
. 2013 Sep 27;54(9):6446-55.
doi: 10.1167/iovs.13-12575.

Development of a rat schematic eye from in vivo biometry and the correction of lateral magnification in SD-OCT imaging

Affiliations
Comparative Study

Development of a rat schematic eye from in vivo biometry and the correction of lateral magnification in SD-OCT imaging

Diana C Lozano et al. Invest Ophthalmol Vis Sci. .

Abstract

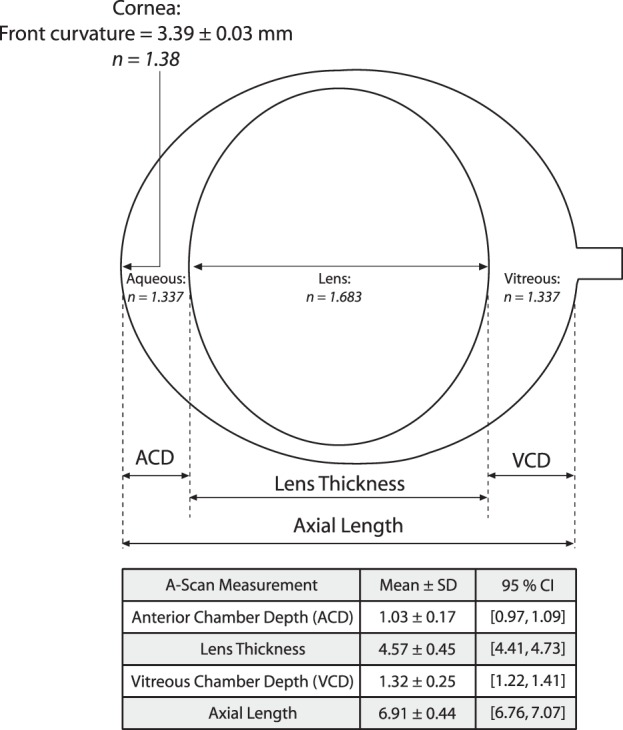
Purpose: Optical magnification in optical coherence tomography (OCT) depends on ocular biometric parameters (e.g., axial length). Biometric differences between eyes will influence scan location. A schematic model eye was developed to compensate for lateral magnification in OCT images of the healthy rat.

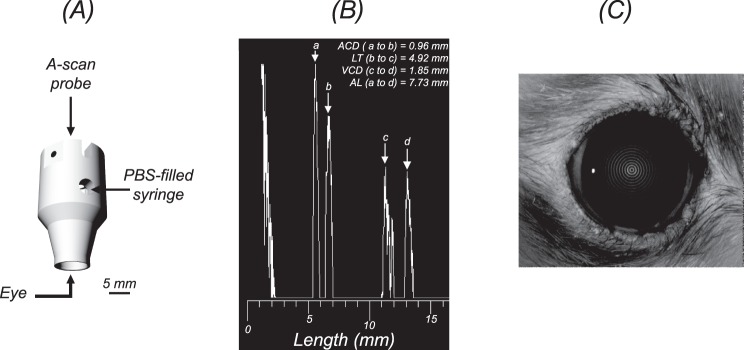
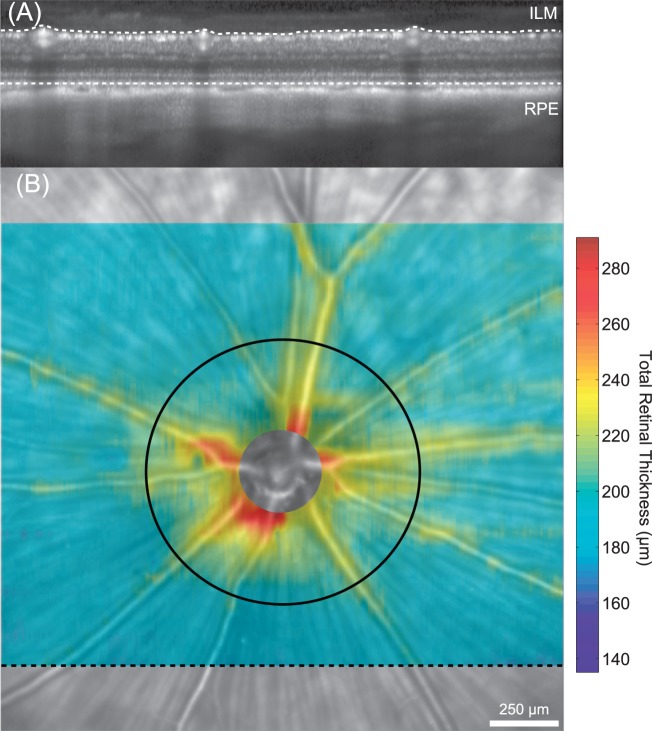
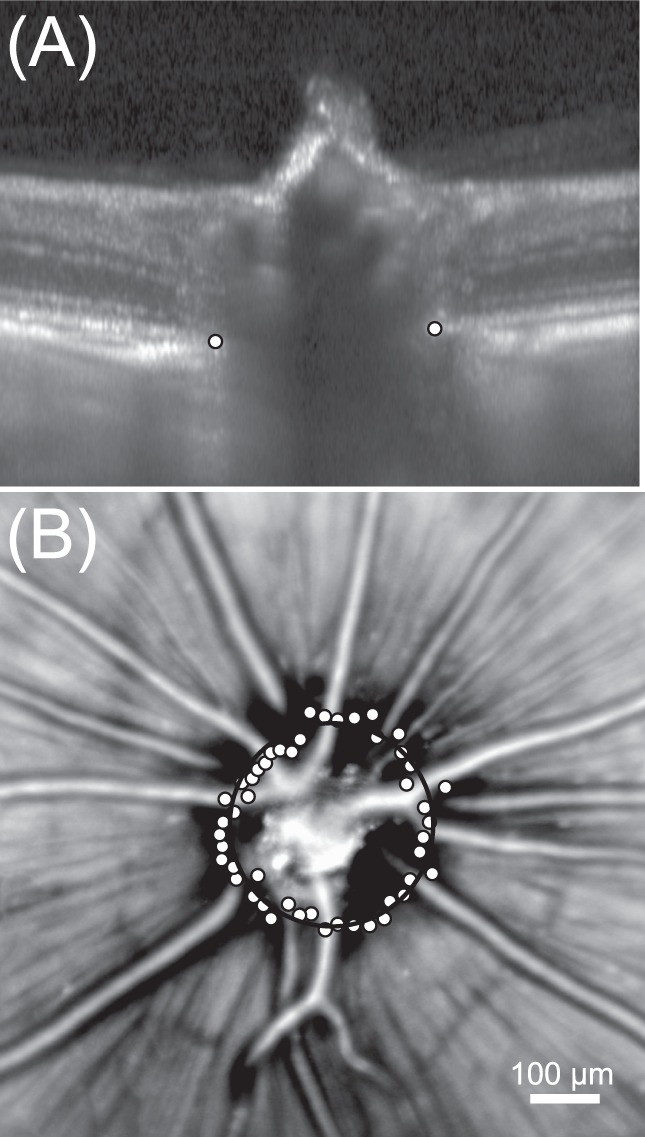
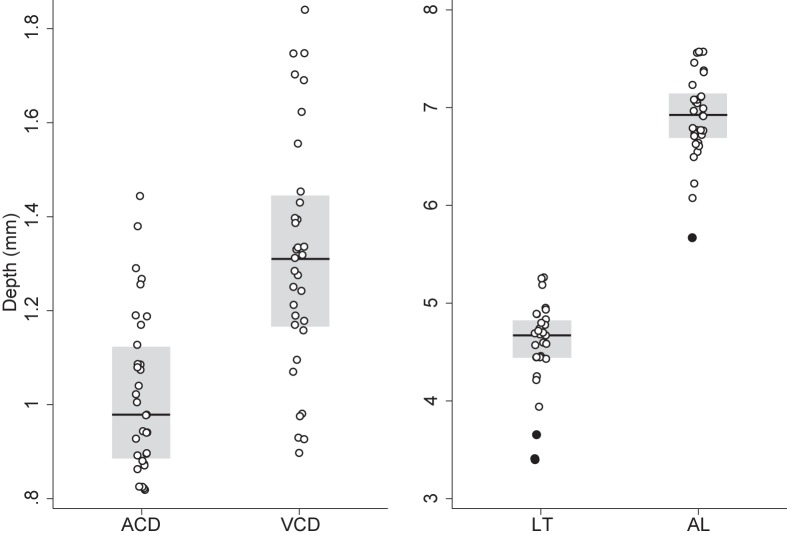
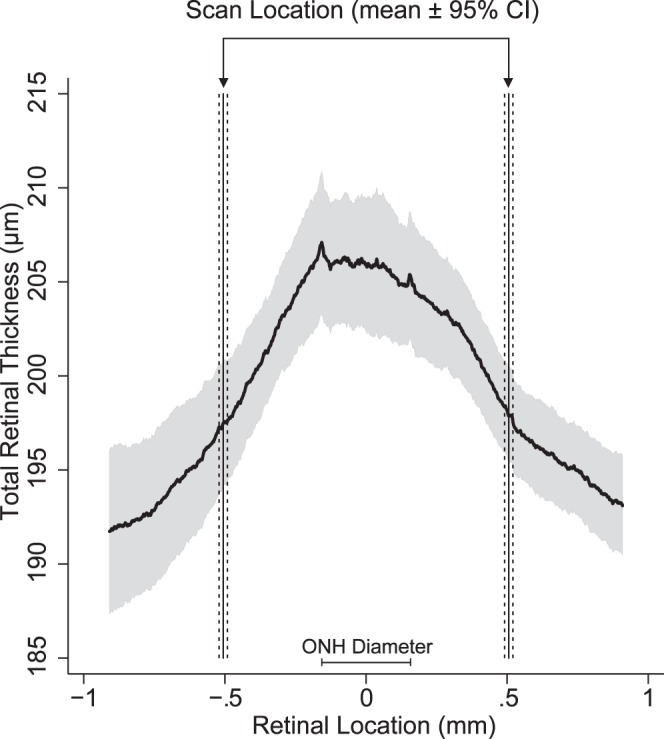
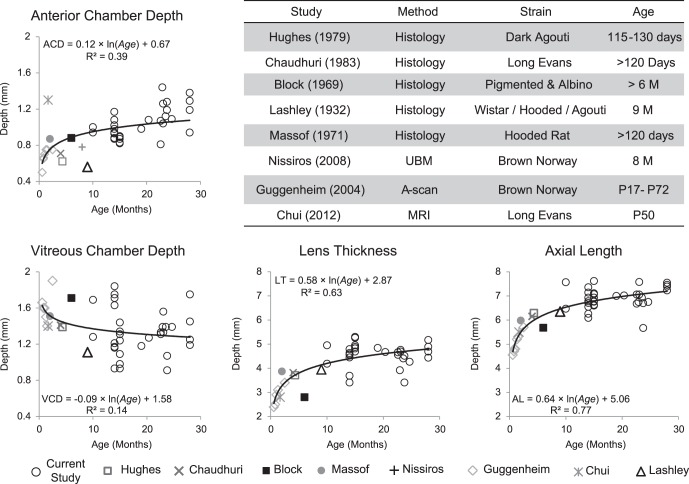
Methods: Spectral-domain optical coherence tomography images were acquired in 19 eyes of 19 brown Norway rats. Images were scaled using the OCT instrument's built-in scaling function and by calculating the micron per degree from schematic model eyes developed from in vivo biometry (immersion A-scan and videokeratometry). Mean total retinal thickness was measured 500 μm away from the optic nerve head and optic nerve head diameter was measured. Corneal curvature, lens thickness, and axial length were modified to calculate their effects on OCT scan location and total retinal thickness.

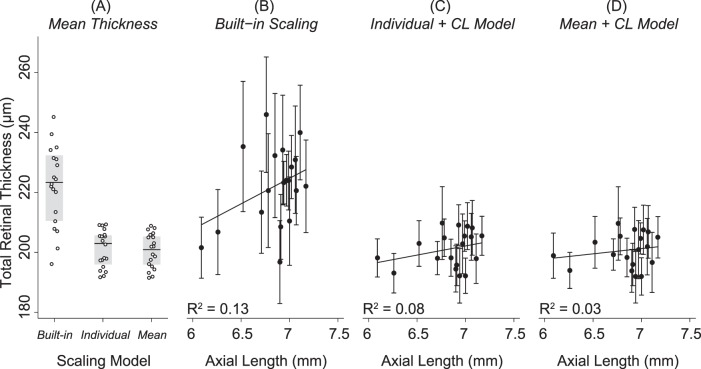
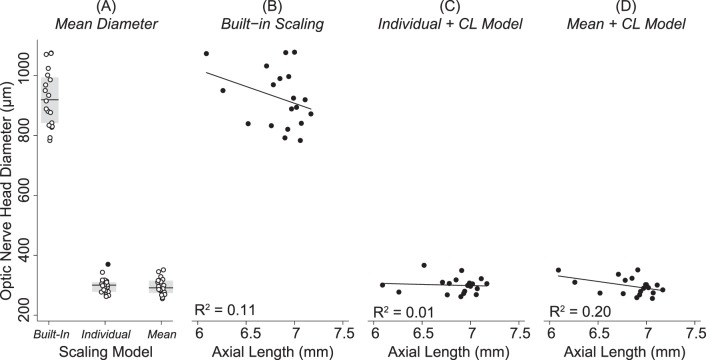
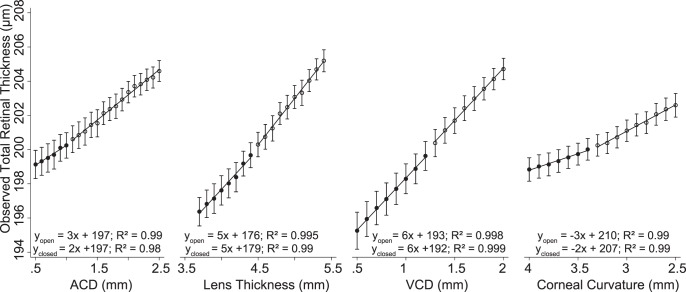
Results: Mean total retinal thickness increased by 21 μm and the SD doubles when images were scaled with the Built-in scaling (222 ± 13 μm) compared with scaling with individual biometric parameters (201 ± 6 μm). Optic nerve head diameter was three times larger when images were scaled with the Built-in scaling (925 ± 97 μm) than the individual biometric parameters (300 ± 27 μm). Assuming no other change in biometric parameters, total retinal thickness would decrease by 37 μm for every millimeter increase in anterior chamber depth due to changes in ocular lateral magnification and associated change in scan location.

Conclusions: Scaling SD-OCT images with schematic model eyes derived from individual biometric data is important. This approach produces estimates of retinal thickness and optic nerve head size that are in good agreement with previously reported measurements.

Keywords: A-scan ultrasonography; age-related biometry changes; biometry; corneal topography; image lateral magnification; optical coherence tomography; rat; retinal thickness.


Figures

Figure 1
Figure 1
Measuring the ocular dimensions in the healthy brown Norway rat. (A) A custom-built immersion cup, scaled for the rat eye, was used to acquire ultrasonic immersion A-scans. (B) A sample immersion A-scan showing the anterior corneal peak (a), anterior (b), and posterior (c) crystalline lens peaks, and retinal peak (d). Anterior chamber depth was measured as the distance between a and b; LT was measured between b and c; VCD is the distance between c and d; and AL is the distance between a and d. (C) Anterior corneal curvature was measured using Placido videokeratography.
Figure 2
Figure 2
The schematic model eye was developed from the position and curvature of the refractive surfaces of the rat eye. The cornea was treated as a single refracting surface, while the index of refraction of the crystalline lens was considered to be homogenous. Measured values included in the schematic model and table: ACD, LT, VCD, AL, and K. Indices of refraction (italicized numbers) were based on previous studies by Hughes.
Figure 3
Figure 3
Total retinal thickness measurements in the healthy brown Norway rat. (A) Total retinal thickness was measured from volumetric SD-OCT scans (25°h × 30°w) comprised of 31 horizontally oriented b-scans. The black dashed line in (B) shows the location where the OCT image (A) was acquired. Total retinal thickness was calculated as the distance from the ILM to the RPE. (B) Spatial thickness maps were generated from bilinear interpolation of thickness measurements between successive B-scans. The retinal thickness map is superimposed on top of the scanning laser ophthalmoscope image and shows that thicker measurements are consistently located around blood vessels and near the optic nerve head. The black circle (diameter = 1 mm) was placed on the optic nerve head center and shows the location where mean thickness measurements were calculated and compared between animals.
Figure 4
Figure 4
Measuring the diameter of the optic nerve head in the healthy brown Norway rat. (A) Radial scans were acquired around the optic nerve and BMO was manually annotated (white points) for each B-scan (n = 24 radial scans). (B) Bruch's membrane opening annotations are plotted (white points) on top of the scanning laser ophthalmoscopy image. The optic nerve head diameter was measured from a circle fit (black circle) through BMO annotations.
Figure 5
Figure 5
Distribution of ultrasonic immersion A-scan biometric measurements in the healthy brown Norway rat. The points are the ACD, VCD, LT, and AL measurements included in the schematic model eye, the solid black line is the median, the gray box is the interquartile range (IQR), and filled in points are points that fall outside ±1.5×IQR.
Figure 6
Figure 6
Mean total retinal thickness measured 500 μm away from the optic nerve head center in healthy brown Norway rats. (A) Mean total retinal thickness for each animal (white points) after images were scaled using the Built-in scaling, Individual + CL Model, or Mean + CL Model. The gray box shows the IQR of the data and the black line is the median. Significantly greater total retinal thickness measurements were acquired after images were scaled using the built-in factor (222 ± 13 μm) than either the Individual + CL Model (201 ± 6 μm; P < 0.001) or the Mean + CL Model (201 ± 6 μm; P < 0.001). Total retinal thickness was not significantly (P = 0.74) different when images were scaled with the Individual + CL or the Mean + CL Model. (B) The goodness of fit (R2) between total retinal thickness and AL was weak and not significantly different from zero after images were scaled with the Built-in Model (R2 = 0.13; P = 0.12) or the (C) Individual + CL Model (R2 = 0.08; P = 0.24) or (D) the Mean + CL Model (R2 = 0.03; P = 0.47).
Figure 7
Figure 7
Optic nerve head size in the healthy brown Norway rat. (A) Points show the distribution in optic nerve head sizes between animals included in the study, the gray box shows the IQR of the data, the black line is the median, and the filled in points are points that fall outside ±1.5×IQR. Optic nerve head diameter was significantly larger when images were scaled with the Built-In scaling (925 ± 97 μm) than when images were scaled with the Individual + CL Model (300 ± 27 μm, P < 0.001) or the Mean + CL Model (297 ± 29 μm, P < 0.001). There was a weak and nonsignificant relationship between optic nerve head diameter and AL after images were scaled using the (B) Built-in model (R2 = 0.11, P = 0.17), (C) the Individual + CL Model (R2 = 0.01; P = 0.74), or the (D) Mean + CL Model (R2 = 0.20; P = 0.06).
Figure 8
Figure 8
Four simulations were developed to quantify the impact of changing the model eye parameters on scan location and measured total retinal thickness at the new scan location. In these simulations, one parameter (ACD, LT, VCD, or K) was modified at a time while setting all others to their mean value. Axial length was considered to be the summation of ACD, LT, and VCD. Each parameter (ACD, LT, VCD, or K) was modified to be either smaller (closed circles) or larger (opened circles) than the mean value for that particular parameter. The linear regression equations show that total retinal thickness changed between 2 and 6 μm per millimeter change in the parameters.
Figure 9
Figure 9
Distribution in total retinal thickness within the central 2-mm retinal area in healthy brown Norway rats. Total retinal thickness maps were scaled using the Mean + CL Model and cropped to cover a similar retinal area between animals. The mean (solid curved line) and 95% CIs (gray area) was calculated along the horizontal dimension from these maps. The Individual + CL Model was used to determine the expected scan location. The vertical solid lines represent the mean scan location and the dashed lines are the associated 95% CI. This figure illustrates the variability in OCT scan location due to differences in biometry between animals as well as the possible range of observed total retinal thickness due to scan position.
Figure 10
Figure 10
Age-related changes in ACD, VCD, LT, and AL in healthy rats. The table shows the method used to measure these ocular dimensions, the strain, and age of the animals. These graphs show that there is an early fast growth in the ocular dimension in the rat eye and the growth progressively slows as the animal ages.

Similar articles

Cited by

References

    1. Block MT. A note on the refraction and image formation of the rat's eye. Vision Res. 1969; 9: 705–711 - PubMed
    1. Chaudhuri A, Hallett PE, Parker JA. Aspheric curvatures, refractive indices and chromatic aberration for the rat eye. Vision Res. 1983; 23: 1351–1363 - PubMed
    1. Hughes A. A schematic eye for the rat. Vision Res. 1979; 19: 569–588 - PubMed
    1. Geng Y, Greenberg KP, Wolfe R, et al. In vivo imaging of microscopic structures in the rat retina. Invest Ophthalmol Vis Sci. 2009; 50: 5872–5879 - PMC - PubMed
    1. Higashide T, Kawaguchi I, Ohkubo S, Takeda H, Sugiyama K. In vivo imaging and counting of rat retinal ganglion cells using a scanning laser ophthalmoscope. Invest Ophthalmol Vis Sci. 2006; 47: 2943–2950 - PubMed

Publication types