. 2013 Dec;62(12):4122-31.
doi: 10.2337/db13-0518. Epub 2013 Aug 29.

PPARα and Sirt1 mediate erythropoietin action in increasing metabolic activity and browning of white adipocytes to protect against obesity and metabolic disorders

Affiliations

PPARα and Sirt1 mediate erythropoietin action in increasing metabolic activity and browning of white adipocytes to protect against obesity and metabolic disorders

Li Wang et al. Diabetes. 2013 Dec.

Abstract

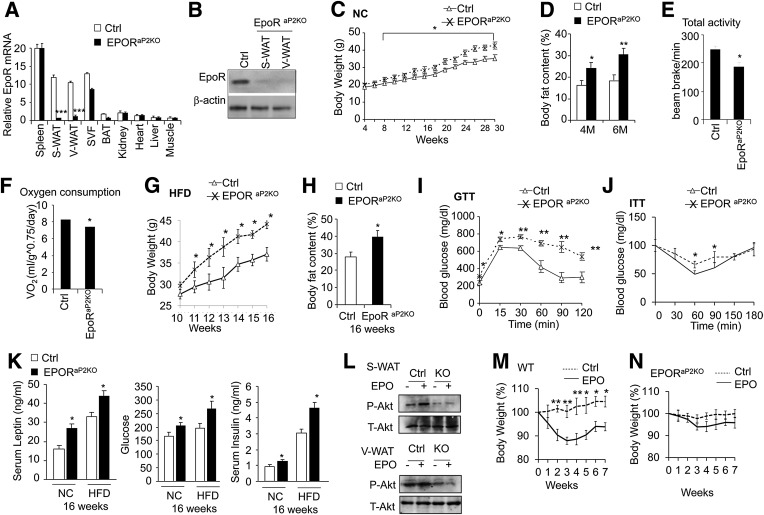
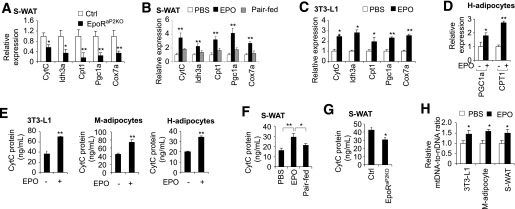
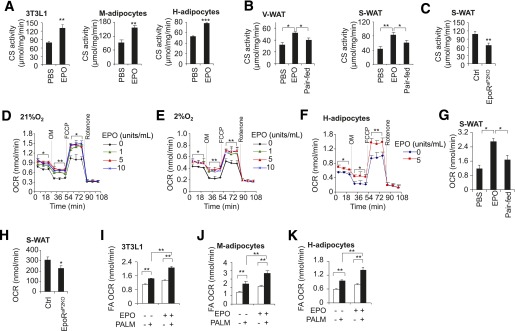
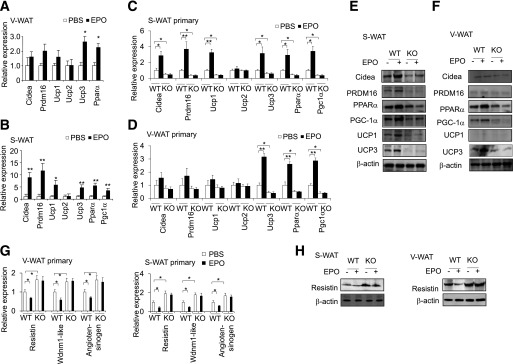
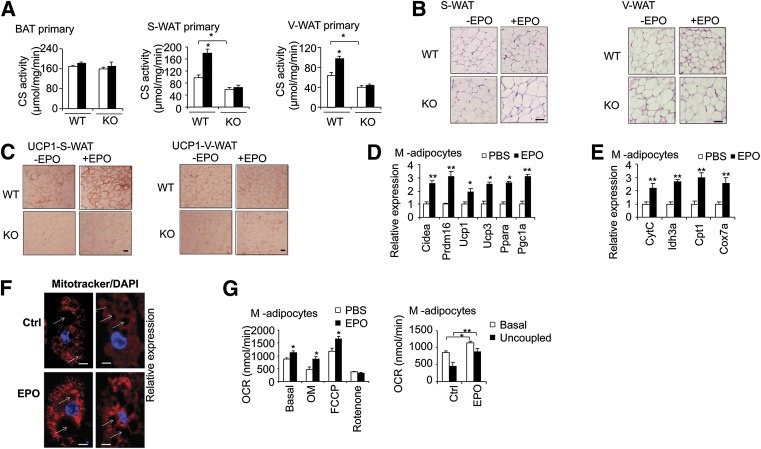
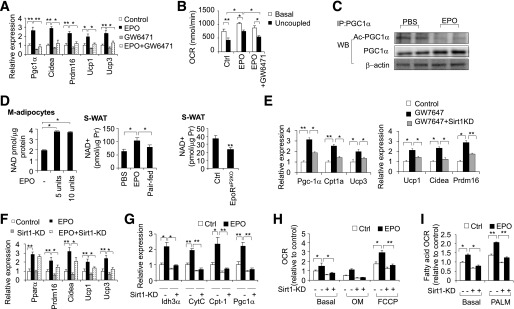
Erythropoietin (EPO) has shown beneficial effects in the regulation of obesity and metabolic syndrome; however, the detailed mechanism is still largely unknown. Here, we created mice with adipocyte-specific deletion of EPO receptor. These mice exhibited obesity and decreased glucose tolerance and insulin sensitivity, especially when fed a high-fat diet. Moreover, EPO increased oxidative metabolism, fatty acid oxidation, and key metabolic genes in adipocytes and in white adipose tissue from diet-induced obese wild-type mice. Increased metabolic activity by EPO is associated with induction of brown fat-like features in white adipocytes, as demonstrated by increases in brown fat gene expression, mitochondrial content, and uncoupled respiration. Peroxisome proliferator-activated receptor (PPAR)α was found to mediate EPO activity because a PPARα antagonist impaired EPO-mediated induction of brown fat-like gene expression and uncoupled respiration. PPARα also cooperates with Sirt1 activated by EPO through modulating the NAD+ level to regulate metabolic activity. PPARα targets, including PPARγ coactivator 1α, uncoupling protein 1, and carnitine palmitoyltransferase 1α, were increased by EPO but impaired by Sirt1 knockdown. Sirt1 knockdown also attenuated adipose response to EPO. Collectively, EPO, as a novel regulator of adipose energy homeostasis via these metabolism coregulators, provides a potential therapeutic strategy to protect against obesity and metabolic disorders.


Figures

FIG. 1.
FIG. 1.
EpoRaP2KO mice become obese, glucose-intolerant, and insulin-resistant. A: EpoR mRNA levels in tissues from EpoRaP2KO mice and littermate controls were quantified using quantitative PCR. B: EPOR protein level in WAT from EpoRaP2KO mice and littermate controls (Ctrl; EpoRfl/fl). C: Body weight vs. age of EpoRaP2KO mice and littermate controls (Ctrl) are indicated for male mice (n = 10) fed a normal chow (NC) diet. D: Body fat mass content of EpoRaP2KO mice and littermate controls (Ctrl) at indicated age are shown for male mice (n = 6). M, months. Total activity (E) and total Vo2 (F) were determined for male WT and EpoRaP2KO mice (n = 6). Male EpoRaP2KO mice and littermate controls (Ctrl) were treated with an HFD for 6 weeks. Body weight was monitored weekly (G), and body fat mass content (H) was determined at 16 weeks (n = 6). GTT (I) and ITT (J) on male EpoRaP2KO mice and littermate controls (Ctrl) were performed at 16 weeks after HFD treatment for 6 weeks (n = 6). K: Serum insulin, glucose, and leptin levels were measured in EpoRaP2KO mice and littermate controls (Ctrl) fed NC and the HFD (n = 6). L: Total (T)-AKT and phosphorylated (P)-AKT in primary adipocytes of S-WAT and V-WAT isolated from EpoRaP2KO mice (KO) and control (Ctrl) mice were analyzed by Western blotting. WT (M) and EpoRaP2KO (N) mice (8.5 months of age) fed a normal diet were treated with EPO or saline (Ctrl) for 3 weeks (n = 6). Body weight was monitored weekly for up to 4 weeks after treatment. Bar graphs are mean ± SEM. *P < 0.05; **P < 0.01; ***P < 0.001.
FIG. 2.
FIG. 2.
EPO signaling in white fat and adipocytes promotes expression of mitochondrial gene expression and increases mitochondrial DNA level. Expression of mitochondrial activity–related genes was quantified using quantitative PCR in S-WAT from EpoRaP2KO and littermate control mice (A), in S-WAT from DIO mice treated with EPO or PBS (B), and in 3T3-L1 adipocytes with PBS or EPO treatment (5 units/mL) (C). D: Expression of mitochondrial function–related genes, PGC1a and CPT1, without and with EPO treatment, in differentiated H-adipocytes was also determined. CytC protein levels were determined by ELISA in 3T3-L1 adipocytes, M-adipocytes, and H-adipocytes, without and with EPO treatment (E), and in S-WAT from the DIO mice treated for 5 weeks with EPO or PBS or paired-fed (F), and S-WAT from EpoRaP2KO and littermate control mice (n = 6) (G). H: The ratio of mtDNA to nuclear DNA (nDNA) was determined by qPCR in 3T3-L1 adipocytes, M-adipocytes, and S-WAT from DIO mice treated with EPO or PBS (n = 6). One-way ANOVA was used in B and F. All other statistics were performed using the Student t test. Bar graphs are mean ± SEM. In vitro data are means of three independent experiments. *P < 0.05; **P < 0.01.
FIG. 3.
FIG. 3.
EPO increases adipocyte mitochondrial activity and Vo2 capacity. CS activity in differentiated 3T3-L1 adipocytes, M-adipocytes, and H-adipocytes, without or with EPO treatment (5 units/mL) (A), and in V-WAT and S-WAT of EPO-treated mice (B) and in S-WAT of EpoRaP2KO and littermate control mice (n = 6) (C). OCR at basal conditions and with addition of oligomycin (OM), FCCP, and rotenone in 3T3-L1 adipocytes treated without and with EPO at the indicated EPO dose and cultured at normoxia (21% O2) (D), and hypoxia (2% O2) (E) for 48 h. F: OCRs in H-adipocytes without and with EPO treatment (5 units/mL) at 21% O2 are shown. OCRs in primary adipocytes isolated from S-WAT of the DIO mice treated without (PBS) and with EPO for 5 weeks (G) and in EpoRaP2KO and littermate control mice (H) were determined and compared with samples prepared from paired-fed mice (n = 6). Data are representative of three independent experiments and normalized to total cellular protein. The OCR was assessed for palmitate (PALM)-driven (white bar, without palmitate; black bar, with palmitate), fatty acid (FA) oxidation in cultures of 3T3-L1 adipocytes (I), and in primary M-adipocytes (J) and H-adipocytes (K), without or with EPO treatment (5 units/mL). One-way ANOVA was used in B, D, E, G, and IK. All other statistics were performed using the Student t test. Bar graphs are mean ± SEM. In vitro data are means of three independent experiments. *P < 0.05; **P < 0.01; ***P < 0.001.
FIG. 4.
FIG. 4.
EPO promotes brown fat–associated gene and protein expression in WAT. Expression of BAT-associated genes in V-WAT (A) and S-WAT (B) in DIO mice treated without (PBS) and with EPO for 2.5 weeks was determined (n = 6). Expression of BAT-associated genes in primary adipocytes isolated from S-WAT (C) and V-WAT (D) in EpoRaP2KO (KO) and WT control mice without (PBS) and with EPO treatment were determined and compared (n = 4). The protein level of BAT-associated factors in S-WAT (E) and V-WAT (F) in EpoRaP2KO (KO) and littermate control mice without (PBS) and with EPO treatment (n = 4). Expression of mRNA (G) and protein (H) of white fat–associated genes (G) and Resistin in primary adipocytes isolated from S-WAT and V-WAT in EpoRaP2KO (KO) and WT control mice without (PBS) and with EPO treatment were determined (n = 4). One-way ANOVA was used in C, D, and G. All other statistics were performed using the Student t test. Bar graphs are mean ± SEM. In vitro data are means of three independent experiments. *P < 0.05; **P < 0.01.
FIG. 5.
FIG. 5.
EPO promotes brown features in WAT. A: CS activity in various primary adipocytes isolated from WT control and EpoRaP2KO mice (KO) without (□, PBS) or with (■) EPO treatment was determined (n = 4). B: Hematoxylin and eosin staining of S-WAT and V-WAT from WT and EpoRaP2KO (KO) mice is shown (scale bar: 20 μm). C: Immunohistochemistry staining for UCP-1 in S-WAT and V-WAT from WT and EpoRaP2KO (KO) mice is shown (scale bar: 20 μm). SVF from the inguinal fat pad was differentiated into adipocytes for 6 days (M-adipocytes) without (PBS) and with EPO treatment (5 units/mL), and expression of BAT associated genes (D) and mitochondrial biogenesis–related genes (E) was determined using quantitative PCR. F: Mitochondria and the nucleus were visualized using MitoTracker (red) and DAPI (blue), respectively, and confocal microscopy. The white arrows indicate lipid droplets. Cells were counterstained with DAPI to detect nuclei (blue). Views are at original magnification ×60. Scale bars: 10 μm. G: Total and uncoupled OCRs in M-adipocytes treated without (PBS) or with EPO (5 units/mL) were monitored. Data are representative of three independent experiments and normalized to total cellular protein. Statistics were performed using the Student t test. Bar graphs are mean ± SEM. Data are averages of three independent experiments. Ctrl, control; OM, oligomycin. *P < 0.05; **P < 0.01.
FIG. 6.
FIG. 6.
PPARα cooperates with Sirt1 to mediate adipose response to EPO. BAT-associated genes expression (A) and uncoupled OCR (B) were determined in M-adipocytes with EPO and/or GW6471 (10 µm) treatment for 6 days. C: The change in acetylated PGC-1α (Ac-PGC-1α) with EPO treatment (5 units/mL) was determined by immunoprecipitation (IP) of PGC-1α, followed by Western blotting (WB) for acetylated protein. β-Actin was used as the loading control. D: NAD+ level was determined in M-adipocytes treated with EPO at the indicated dosage and in S-WAT from DIO mice with EPO treatment for 5 weeks and compared with PBS control and paired-fed mice and from EpoRaP2KO and littermate control mice (n = 6). E: Mitochondrial and fatty acid oxidation genes and BAT-associated genes were determined in M-adipocytes treated without (Control) or with GW7647 (1 µm) for 6 days without and with knockdown (KD) of Sirt1. Expression of BAT-associated genes (F) and mitochondrial genes (G), OCR (H), and fatty acid oxidation (I) were determined in M-adipocytes with knockdown (KD) of Sirt1, without and with EPO treatment (5 units/mL). PALM, palmitate. One-way ANOVA was used in A, B, and DI. All other statistics were performed using the Student t test. Bar graphs are mean ± SEM. In vitro data are means of three independent experiments. *P < 0.05; **P < 0.01.

References

    1. Burger D, Lei M, Geoghegan-Morphet N, Lu X, Xenocostas A, Feng Q. Erythropoietin protects cardiomyocytes from apoptosis via up-regulation of endothelial nitric oxide synthase. Cardiovasc Res 2006;72:51–59 - PubMed
    1. Ruschitzka FT, Wenger RH, Stallmach T, et al. Nitric oxide prevents cardiovascular disease and determines survival in polyglobulic mice overexpressing erythropoietin. Proc Natl Acad Sci USA 2000;97:11609–11613 - PMC - PubMed
    1. Carraway MS, Suliman HB, Jones WS, Chen CW, Babiker A, Piantadosi CA. Erythropoietin activates mitochondrial biogenesis and couples red cell mass to mitochondrial mass in the heart. Circ Res 2010;106:1722–1730 - PMC - PubMed
    1. Beleslin-Cokic BB, Cokic VP, Yu X, Weksler BB, Schechter AN, Noguchi CT. Erythropoietin and hypoxia stimulate erythropoietin receptor and nitric oxide production by endothelial cells. Blood 2004;104:2073–2080 - PubMed
    1. Anagnostou A, Liu Z, Steiner M, et al. Erythropoietin receptor mRNA expression in human endothelial cells. Proc Natl Acad Sci U S A 1994;91:3974–3978 - PMC - PubMed

Publication types

MeSH terms