

The chaperone protein clusterin may serve as a cerebrospinal fluid biomarker for chronic spinal cord disorders in the dog
- PMID: 23990410
- PMCID: PMC3982024
- DOI: 10.1007/s12192-013-0457-4
The chaperone protein clusterin may serve as a cerebrospinal fluid biomarker for chronic spinal cord disorders in the dog
Abstract
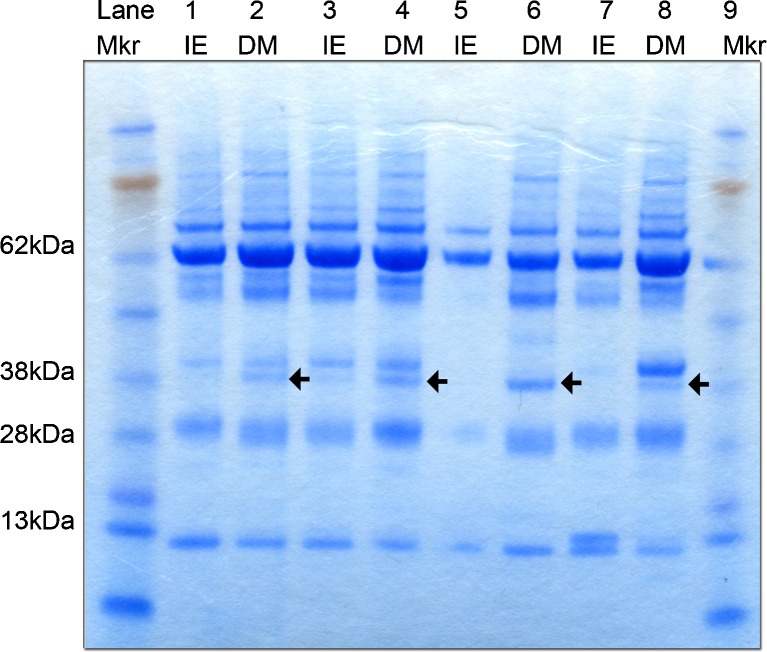
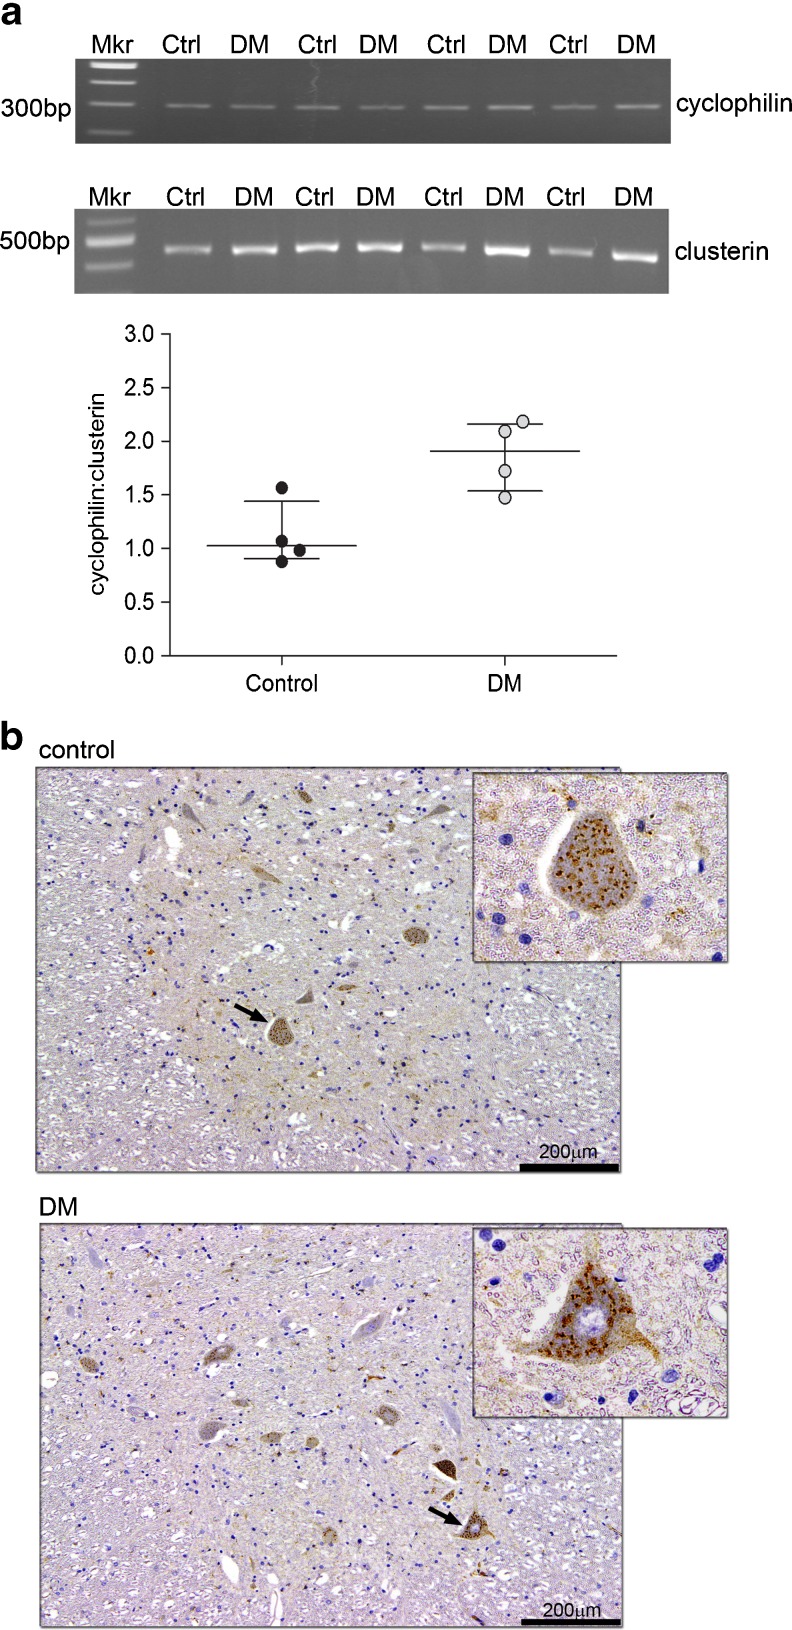
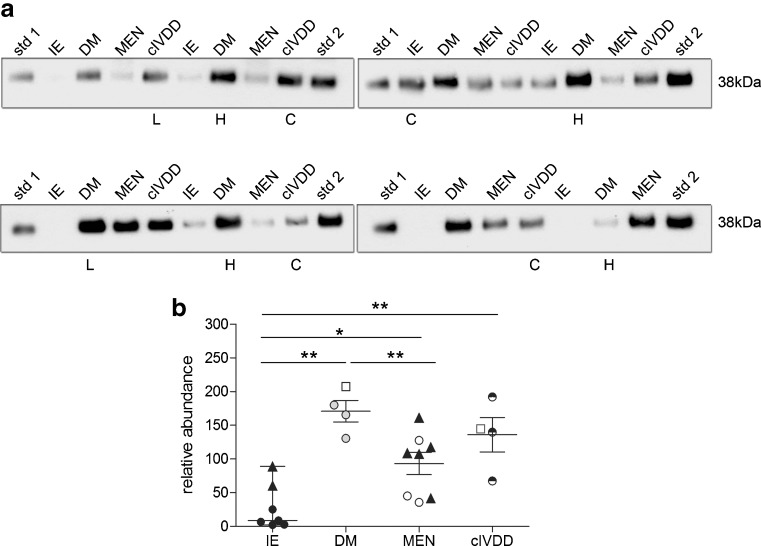
Chronic spinal cord dysfunction occurs in dogs as a consequence of diverse aetiologies, including long-standing spinal cord compression and insidious neurodegenerative conditions. One such neurodegenerative condition is canine degenerative myelopathy (DM), which clinically is a challenge to differentiate from other chronic spinal cord conditions. Although the clinical diagnosis of DM can be strengthened by the identification of the Sod1 mutations that are observed in affected dogs, genetic analysis alone is insufficient to provide a definitive diagnosis. There is a requirement to identify biomarkers that can differentiate conditions with a similar clinical presentation, thus facilitating patient diagnostic and management strategies. A comparison of the cerebrospinal fluid (CSF) protein gel electrophoresis profile between idiopathic epilepsy (IE) and DM identified a protein band that was more prominent in DM. This band was subsequently found to contain a multifunctional protein clusterin (apolipoprotein J) that is protective against endoplasmic reticulum (ER) stress-mediated apoptosis, oxidative stress, and also serves as an extracellular chaperone influencing protein aggregation. Western blot analysis of CSF clusterin confirmed elevated levels in DM compared to IE (p < 0.05). Analysis of spinal cord tissue from DM and control material found that clusterin expression was evident in neurons and that the clusterin mRNA levels from tissue extracts were elevated in DM compared to the control. The plasma clusterin levels was comparable between these groups. However, a comparison of clusterin CSF levels in a number of neurological conditions found that clusterin was elevated in both DM and chronic intervertebral disc disease (cIVDD) but not in meningoencephalitis and IE. These findings indicate that clusterin may potentially serve as a marker for chronic spinal cord disease in the dog; however, additional markers are required to differentiate DM from a concurrent condition such as cIVDD.
Figures


Similar articles
-
Cerebrospinal Fluid Levels of Phosphorylated Neurofilament Heavy as a Diagnostic Marker of Canine Degenerative Myelopathy.J Vet Intern Med. 2017 Mar;31(2):513-520. doi: 10.1111/jvim.14659. Epub 2017 Feb 10. J Vet Intern Med. 2017. PMID: 28186658 Free PMC article.
-
Quantitative assessment of hsp70, IL-1β and TNF-α in the spinal cord of dogs with E40K SOD1-associated degenerative myelopathy.Vet J. 2014 May;200(2):312-7. doi: 10.1016/j.tvjl.2014.03.003. Epub 2014 Mar 21. Vet J. 2014. PMID: 24662024
-
Expression of Autophagy-Related Proteins in the Spinal Cord of Pembroke Welsh Corgi Dogs With Canine Degenerative Myelopathy.Vet Pathol. 2015 Nov;52(6):1099-107. doi: 10.1177/0300985815570070. Epub 2015 Mar 2. Vet Pathol. 2015. PMID: 25732177
-
Conditions of the thoracolumbar spine.Semin Vet Med Surg Small Anim. 1996 Nov;11(4):235-53. doi: 10.1016/s1096-2867(96)80017-x. Semin Vet Med Surg Small Anim. 1996. PMID: 9020577 Review.
-
Degenerative myelopathy.Vet Clin North Am Small Anim Pract. 1992 Jul;22(4):965-71. doi: 10.1016/s0195-5616(92)50087-0. Vet Clin North Am Small Anim Pract. 1992. PMID: 1641928 Review.
Cited by
-
Development and Degeneration of the Intervertebral Disc-Insights from Across Species.Vet Sci. 2023 Aug 24;10(9):540. doi: 10.3390/vetsci10090540. Vet Sci. 2023. PMID: 37756062 Free PMC article. Review.
-
Improper Proteostasis: Can It Serve as Biomarkers for Neurodegenerative Diseases?Mol Neurobiol. 2022 Jun;59(6):3382-3401. doi: 10.1007/s12035-022-02775-w. Epub 2022 Mar 19. Mol Neurobiol. 2022. PMID: 35305242 Review.
-
Cerebrospinal Fluid Levels of Phosphorylated Neurofilament Heavy as a Diagnostic Marker of Canine Degenerative Myelopathy.J Vet Intern Med. 2017 Mar;31(2):513-520. doi: 10.1111/jvim.14659. Epub 2017 Feb 10. J Vet Intern Med. 2017. PMID: 28186658 Free PMC article.
-
Molecular Aspects of Hypoxic Stress Effects in Chronic Ethanol Exposure of Neuronal Cells.Curr Issues Mol Biol. 2023 Feb 16;45(2):1655-1680. doi: 10.3390/cimb45020107. Curr Issues Mol Biol. 2023. PMID: 36826052 Free PMC article.
-
Usefulness of cerebrospinal fluid analysis in dogs and cats with suspected intracranial disease and normal magnetic resonance imaging.Front Vet Sci. 2025 Jun 20;12:1583988. doi: 10.3389/fvets.2025.1583988. eCollection 2025. Front Vet Sci. 2025. PMID: 40621502 Free PMC article.
References
-
- Averill DR. Degenerative myelopathy in the aging German Shepherd dog: clinical and pathologic findings. J. Am. Vet. Med. Assoc. 1973;162:1045–1051. - PubMed
-
- Awano T, Johnson GS, Wade CM, Katz ML, Johnson GC, Taylor JF, Perloski M, Biagi T, Baranowska I, Long S, March PA, Olby NJ, Shelton GD, Khan S, O’Brien DP, Lindblad-Toh K, Coates JR. Genome-wide association analysis reveals a Sod1 mutation in canine degenerative myelopathy that resembles amyotrophic lateral sclerosis. Proc Natl Acad Sci U S A. 2009;106:2794–2799. doi: 10.1073/pnas.0812297106. - DOI - PMC - PubMed
Publication types
MeSH terms
Substances
LinkOut - more resources
Full Text Sources
Other Literature Sources
Medical
Research Materials
Miscellaneous
