

Stroke and the "stroke belt" in dialysis: contribution of patient characteristics to ischemic stroke rate and its geographic variation
- PMID: 23990675
- PMCID: PMC3839545
- DOI: 10.1681/ASN.2012111077
Stroke and the "stroke belt" in dialysis: contribution of patient characteristics to ischemic stroke rate and its geographic variation
Abstract
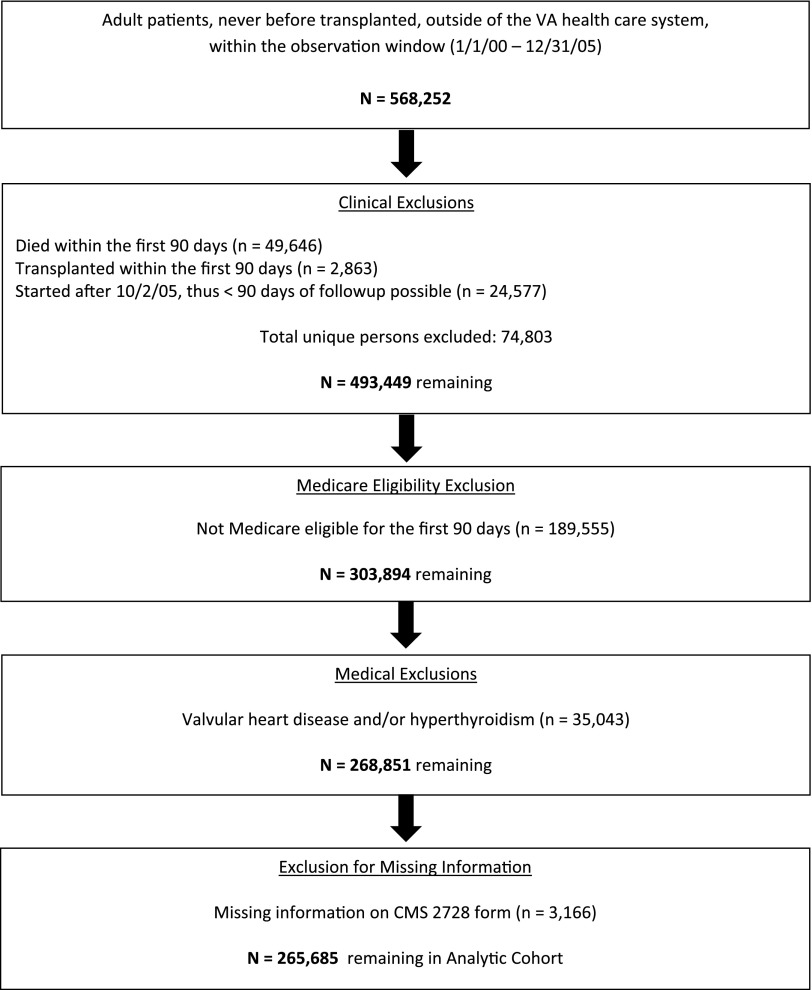
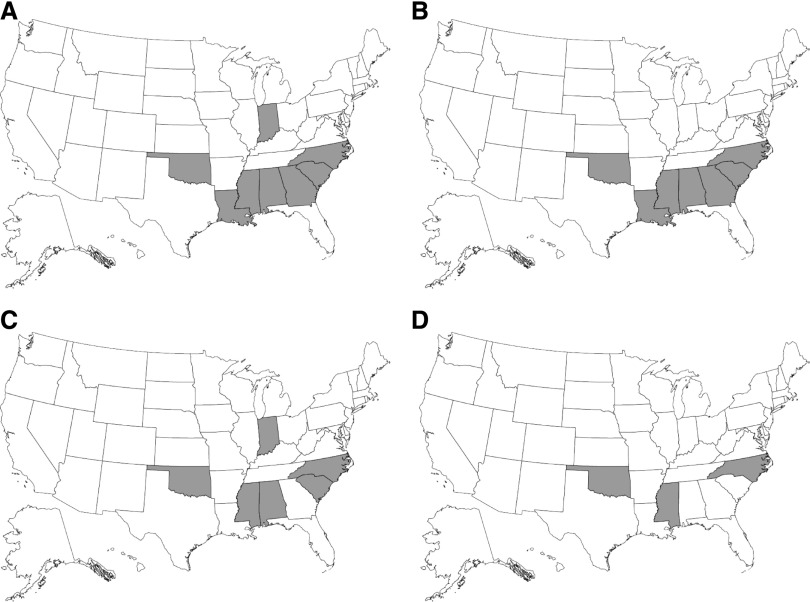
Geographic variation in stroke rates is well established in the general population, with higher rates in the South than in other areas of the United States. ESRD is a potent risk factor for stroke, but whether regional variations in stroke risk exist among dialysis patients is unknown. Medicare claims from 2000 to 2005 were used to ascertain ischemic stroke events in a large cohort of 265,685 incident dialysis patients. A Poisson generalized linear mixed model was generated to determine factors associated with stroke and to ascertain state-by-state geographic variability in stroke rates by generating observed-to-expected (O/E) adjusted rate ratios for stroke. Older age, female sex, African American race and Hispanic ethnicity, unemployed status, diabetes, hypertension, history of stroke, and permanent atrial fibrillation were positively associated with ischemic stroke, whereas body mass index >30 kg/m(2) was inversely associated with stroke (P<0.001 for each). After full multivariable adjustment, the three states with O/E rate ratios >1.0 were all in the South: North Carolina, Mississippi, and Oklahoma. Regional efforts to increase primary prevention in the "stroke belt" or to better educate dialysis patients on the signs of stroke so that they may promptly seek care may improve stroke care and outcomes in dialysis patients.
Figures
References
-
- United States Renal Data System: USRDS 2012 Annual Data Report: Atlas of End-Stage Renal Disease in the United States, Bethesda, MD, National Institutes of Health, National Institute of Diabetes and Digestive and Kidney Diseases, 2012
-
- Lanska DJ: Geographic distribution of stroke mortality in the United States: 1939-1941 to 1979-1981. Neurology 43: 1839–1851, 1993 - PubMed
-
- Covic A, Kanbay M, Voroneanu L, Turgut F, Serban DN, Serban IL, Goldsmith DJ: Vascular calcification in chronic kidney disease. Clin Sci (Lond) 119: 111–121, 2010 - PubMed
Publication types
MeSH terms
Grants and funding
LinkOut - more resources
Full Text Sources
Other Literature Sources
Medical
