

Genic intolerance to functional variation and the interpretation of personal genomes
- PMID: 23990802
- PMCID: PMC3749936
- DOI: 10.1371/journal.pgen.1003709
Genic intolerance to functional variation and the interpretation of personal genomes
Abstract
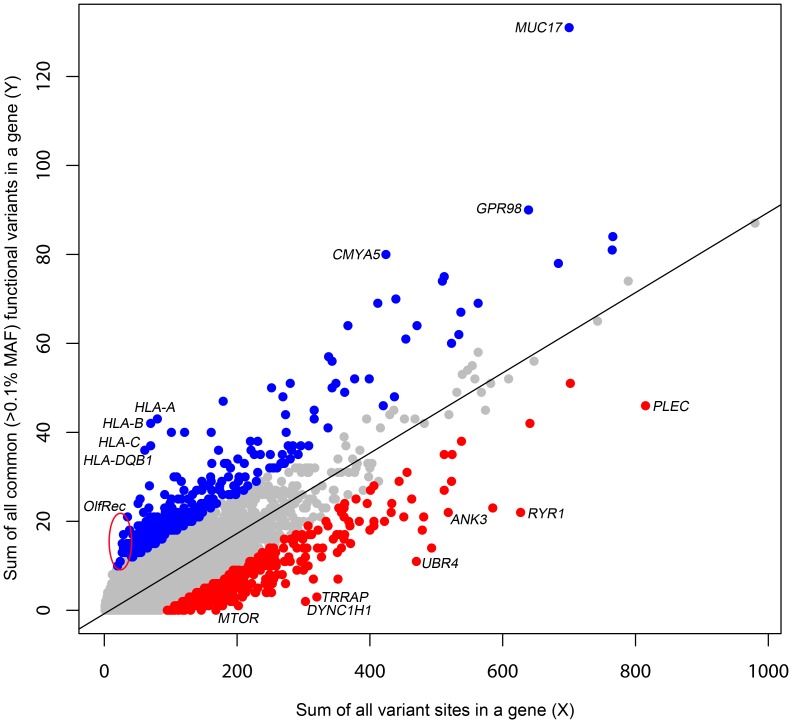
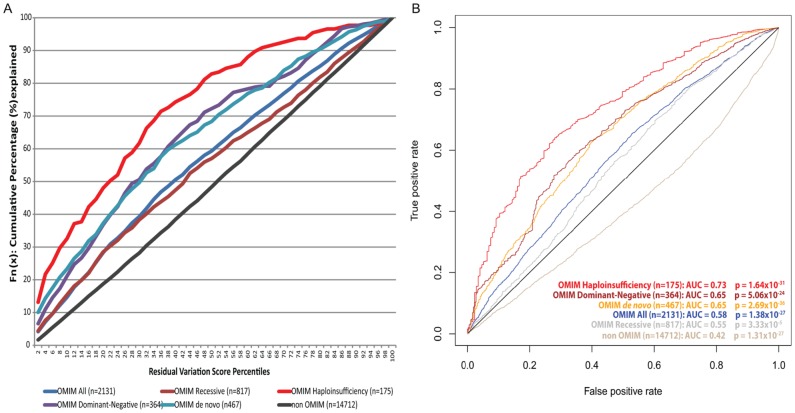
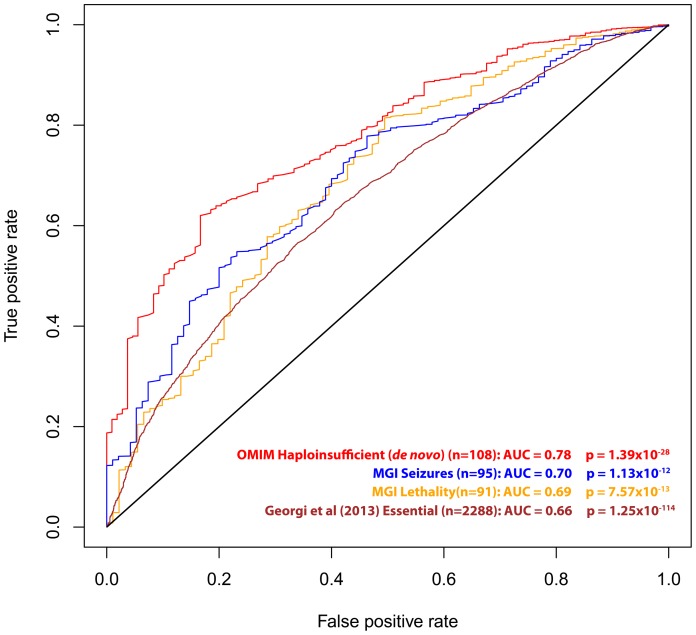
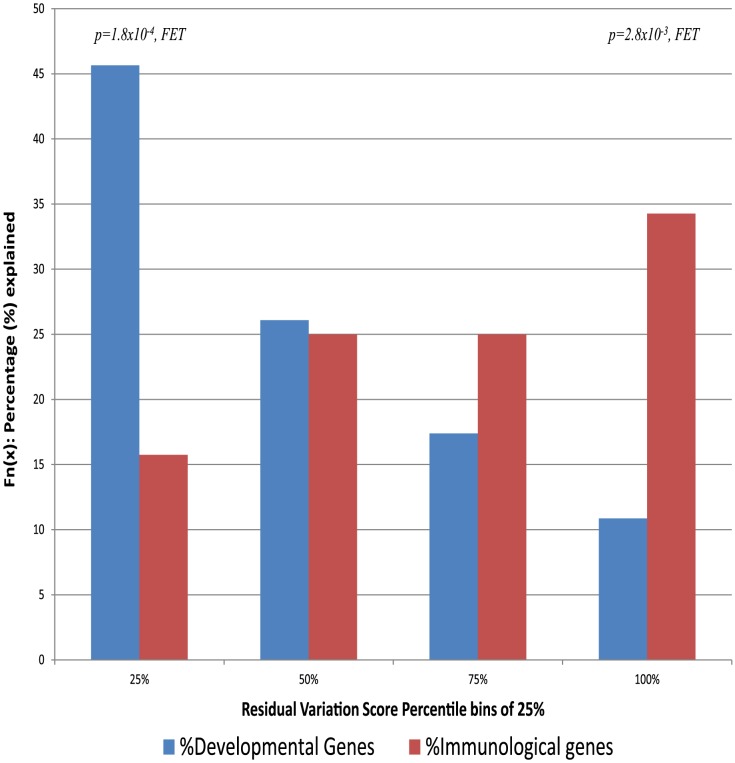
A central challenge in interpreting personal genomes is determining which mutations most likely influence disease. Although progress has been made in scoring the functional impact of individual mutations, the characteristics of the genes in which those mutations are found remain largely unexplored. For example, genes known to carry few common functional variants in healthy individuals may be judged more likely to cause certain kinds of disease than genes known to carry many such variants. Until now, however, it has not been possible to develop a quantitative assessment of how well genes tolerate functional genetic variation on a genome-wide scale. Here we describe an effort that uses sequence data from 6503 whole exome sequences made available by the NHLBI Exome Sequencing Project (ESP). Specifically, we develop an intolerance scoring system that assesses whether genes have relatively more or less functional genetic variation than expected based on the apparently neutral variation found in the gene. To illustrate the utility of this intolerance score, we show that genes responsible for Mendelian diseases are significantly more intolerant to functional genetic variation than genes that do not cause any known disease, but with striking variation in intolerance among genes causing different classes of genetic disease. We conclude by showing that use of an intolerance ranking system can aid in interpreting personal genomes and identifying pathogenic mutations.
Conflict of interest statement
The authors have declared that no competing interests exist.
Figures
References
Publication types
MeSH terms
Grants and funding
- UC2 HL103010/HL/NHLBI NIH HHS/United States
- RC2 HL102926/HL/NHLBI NIH HHS/United States
- U01 NS077303/NS/NINDS NIH HHS/United States
- RC2 HL103010/HL/NHLBI NIH HHS/United States
- RC2 HL102923/HL/NHLBI NIH HHS/United States
- UC2 HL102926/HL/NHLBI NIH HHS/United States
- U01 NS077364/NS/NINDS NIH HHS/United States
- RC2 HL102924/HL/NHLBI NIH HHS/United States
- UC2 HL102923/HL/NHLBI NIH HHS/United States
- UC2 HL102924/HL/NHLBI NIH HHS/United States
- RC2 HL102925/HL/NHLBI NIH HHS/United States
- UC2 HL102925/HL/NHLBI NIH HHS/United States
LinkOut - more resources
Full Text Sources
Other Literature Sources
Medical
