. 2013;9(8):e1003716.
doi: 10.1371/journal.pgen.1003716. Epub 2013 Aug 22.

Combining quantitative genetic footprinting and trait enrichment analysis to identify fitness determinants of a bacterial pathogen

Affiliations

Combining quantitative genetic footprinting and trait enrichment analysis to identify fitness determinants of a bacterial pathogen

Travis J Wiles et al. PLoS Genet. 2013.

Abstract

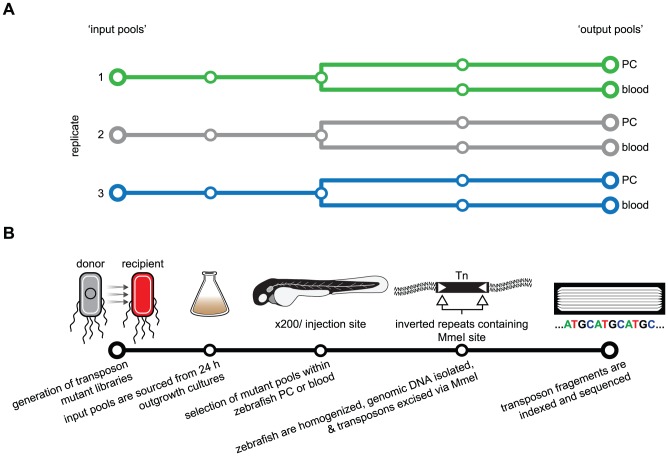
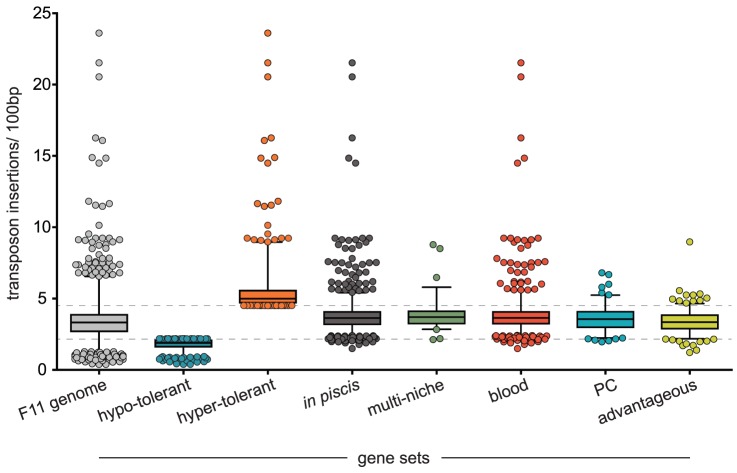
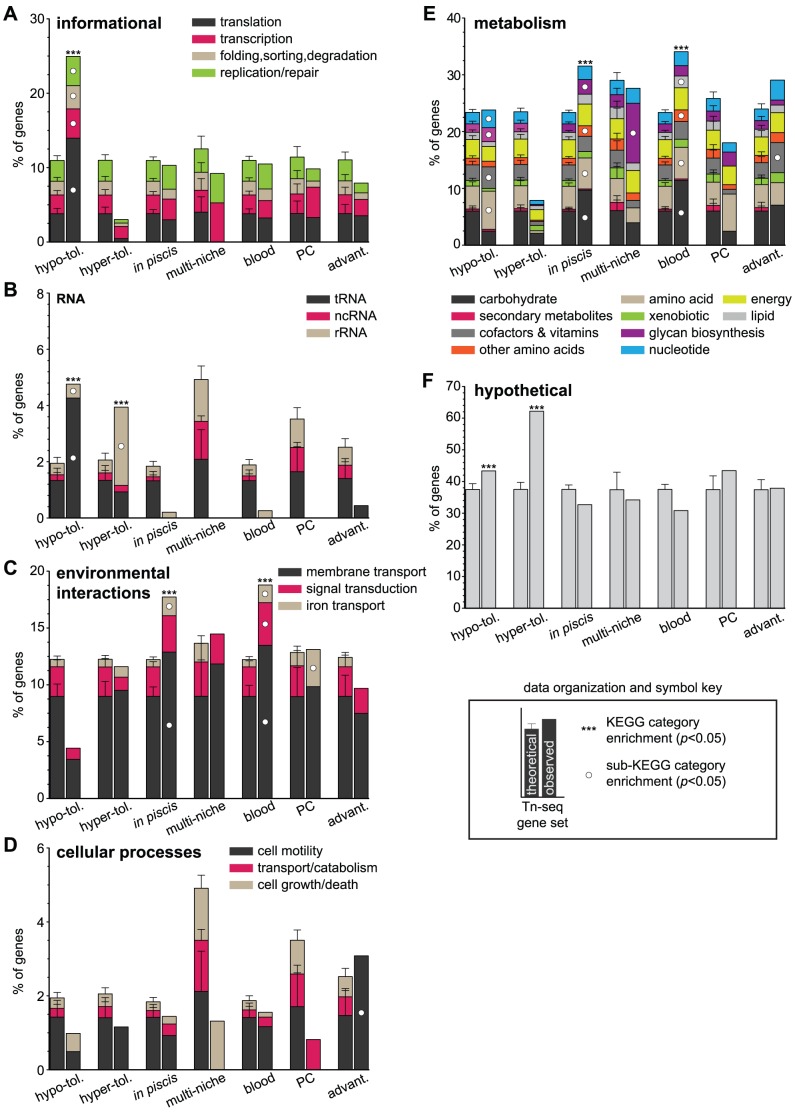
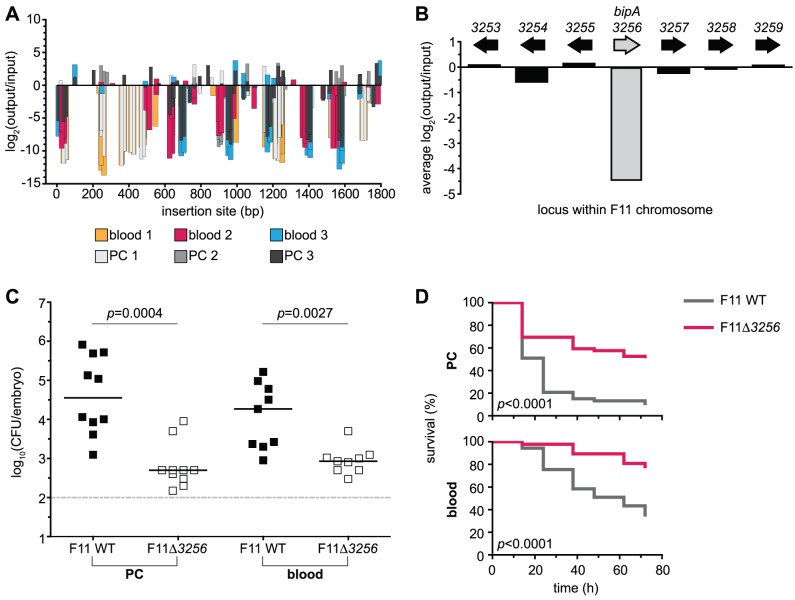
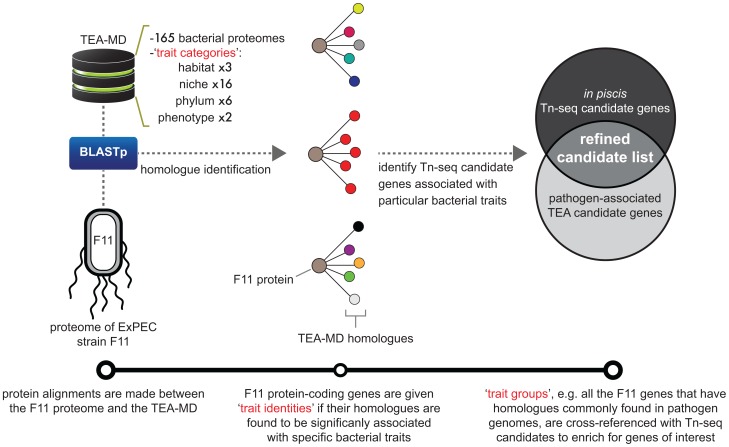
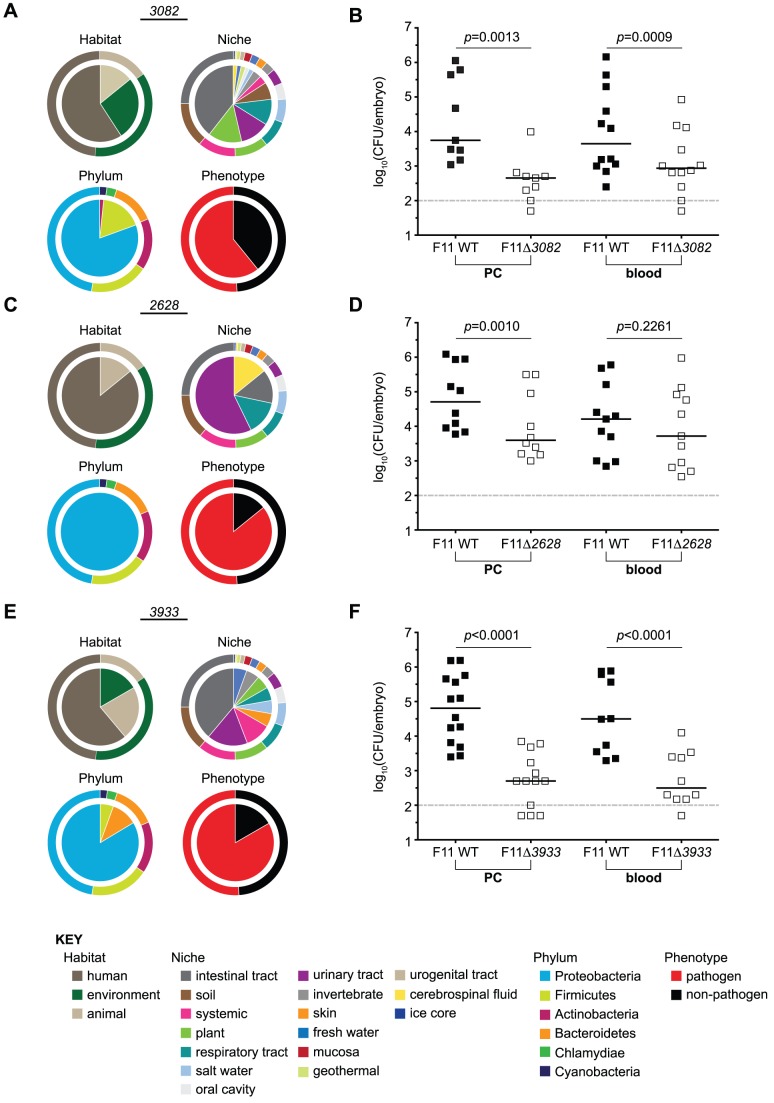
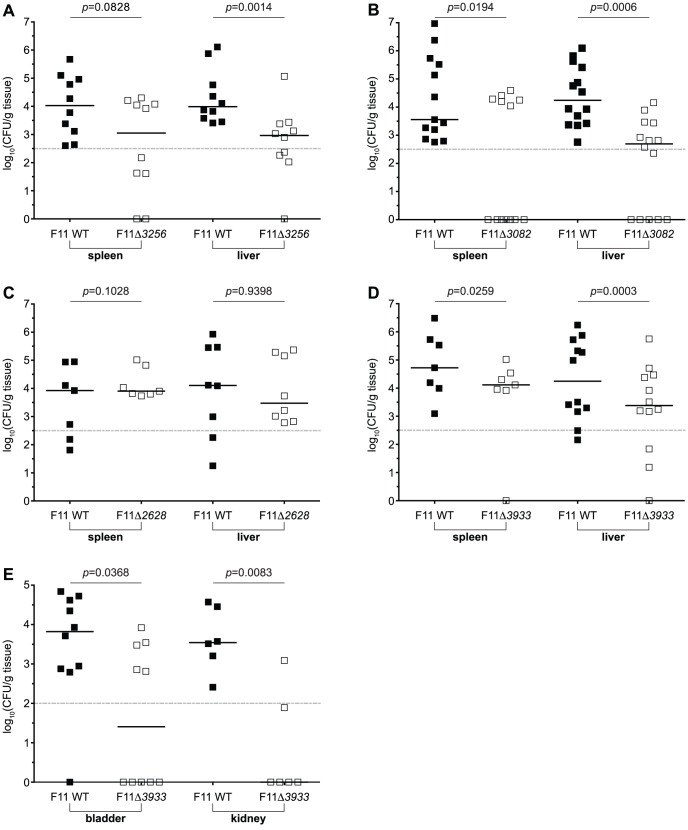
Strains of Extraintestinal Pathogenic Escherichia c oli (ExPEC) exhibit an array of virulence strategies and are a major cause of urinary tract infections, sepsis and meningitis. Efforts to understand ExPEC pathogenesis are challenged by the high degree of genetic and phenotypic variation that exists among isolates. Determining which virulence traits are widespread and which are strain-specific will greatly benefit the design of more effective therapies. Towards this goal, we utilized a quantitative genetic footprinting technique known as transposon insertion sequencing (Tn-seq) in conjunction with comparative pathogenomics to functionally dissect the genetic repertoire of a reference ExPEC isolate. Using Tn-seq and high-throughput zebrafish infection models, we tracked changes in the abundance of ExPEC variants within saturated transposon mutant libraries following selection within distinct host niches. Nine hundred and seventy bacterial genes (18% of the genome) were found to promote pathogen fitness in either a niche-dependent or independent manner. To identify genes with the highest therapeutic and diagnostic potential, a novel Trait Enrichment Analysis (TEA) algorithm was developed to ascertain the phylogenetic distribution of candidate genes. TEA revealed that a significant portion of the 970 genes identified by Tn-seq have homologues more often contained within the genomes of ExPEC and other known pathogens, which, as suggested by the first axiom of molecular Koch's postulates, is considered to be a key feature of true virulence determinants. Three of these Tn-seq-derived pathogen-associated genes--a transcriptional repressor, a putative metalloendopeptidase toxin and a hypothetical DNA binding protein--were deleted and shown to independently affect ExPEC fitness in zebrafish and mouse models of infection. Together, the approaches and observations reported herein provide a resource for future pathogenomics-based research and highlight the diversity of factors required by a single ExPEC isolate to survive within varying host environments.


Conflict of interest statement

The authors have declared that no competing interests exist.

Figures

Figure 1
Figure 1. Schematic of the Tn-seq selection screen used to identify genes necessary for fitness in a zebrafish infection model.
(A) Three selection screens were performed (green, grey and blue tracks) using three ‘input’ pools to generate a total of six ‘output’ pools. (B) For each replicate screen, an independent transposon mutant library was created. Expansion of mutant libraries from frozen stocks was done at 37°C for 24 h to produce input pools and starting inoculum. Approximately 200 zebrafish embryos were injected in the pericardial cavity (PC) or circulation valley (CV, blood) with approximately 3,000 mutant bacteria. After a selection period of 20 h, zebrafish were homogenized to facilitate recovery and extraction of total DNA. The restriction enzyme MmeI was used to excise transposons and flanking F11 genomic DNA for analysis by deep sequencing.
Figure 2
Figure 2. Transposon insertion rates for loci within different gene sets.
From each input pool (1, 2 and 3) an average number of insertions detected per 100 bp was calculated for each annotated region within the F11 genome. Box plots indicate median and interquartile ranges with whiskers extending to the 1st and 99th percentiles. Dashed lines mark the upper and lower boundaries for hypo and hyper-tolerant gene sets, respectively. Gene set sizes: F11 genome - 5,312; hypo-tolerant - 609; hyper-tolerant - 431; in piscis - 970; multi-niche - 76; blood - 772; PC - 122; advantageous - 227. Note, the insertion rates reported here are expected to be overestimated—please refer to Methods section ‘Candidate Identification’ for a complete description of how the number of transposon insertion events was determined.
Figure 3
Figure 3. Functional KEGG categories enriched within gene sets.
To orient the reader to graph organization and symbols, a key is provided in the lower right corner. The cumulative percent of genes (y-axis) within each Tn-seq-derived gene set (x-axis) belonging to the functional categories (A) informational, (B) RNA (C) environmental interactions, (D) cellular processes, (E) metabolism and (F) hypothetical is depicted. The proportion of genes contributed by specific sub-KEGG categories is represented by stacked elements within each column. Significant enrichments for KEGG and sub-KEGG categories are denoted with asterisks and white circles, respectively. Gene set abbreviations: hypo-tol. = hypo-tolerant; hyper-tol. = hyper-tolerant; advant. = advantageous. Theoretical KEGG category compositions for Tn-seq gene sets and p values were determined using 10,000 Monte Carlo simulations (Methods).
Figure 4
Figure 4. Retrospective deletion of the candidate gene EcF11_3256/bipA confirms Tn-seq as a useful tool for the identification of loci required for fitness and virulence.
(A) Inserts found within the locus EcF11_3256/bipA are plotted with respect to their position of integration (x-axis). Magnitude and direction of bars represent the change in fitness of F11 (y-axis) that correlated with a given insertion event. Color of bars denotes pool of origin. Changes in fitness are presented as log2 of the ratio of occurrence frequencies observed between output and input pools (output/input). (B) The average of insert-based fitness changes in (A) is plotted on the x-axis (shaded bar, bipA). For comparison, the average alterations in occurrence frequency ratios for proximal genes are also plotted. (C) Equal numbers (1,000–2,000 CFU total) of wild type and F11Δ3256 were inoculated into the PC (left) or bloodstream (right) of zebrafish embryos. Fish were sacrificed and bacterial loads enumerated ∼20 h post-inoculation by differential plating (n = 9 to 10 zebrafish). Dashed line marks the limit of quantification; p values were determined using a paired t-test, bars indicate medians. (D) The pericardial cavity (PC, top) and blood (bottom) of 48 hpf embryos were inoculated with approximately 3,000 CFU. Fish were scored for death at 0, 12, 24, 36, 48, 60 and 72 h post-inoculation (hpi). Data are presented as Kaplan-Meier survival plots and p values were calculated using a log-rank (Mantel-Cox) test (n>45 for each survival curve).
Figure 5
Figure 5. Diagrammatic workflow of ‘Trait Enrichment Analysis’ (TEA).
This visualization depicts the TEA method and describes the relationships between various data types. Bottom track: linear representation of steps followed in the execution of TEA. Protein alignments are made between F11 proteins and the TEA-MD to identify homologues. Microbes within the TEA-MD are annotated with four separate traits contained within the trait categories: habitat (1 of 3), niche (1 of 16), phylum (1 of 6) and phenotype (1 of 2). The composition of traits associated with homologue sets for each F11 protein is assessed for enriched traits in order to assign trait identities. Trait groups, which are F11 genes that share a particular trait identity, are used to organize Tn-seq-derived candidate genes. TEA-MD = TEA-metaproteome database; BLASTp = Basic Local Alignment Search Tool used to align protein sequences.
Figure 6
Figure 6. Targeted deletion of candidate genes with pathogenic identity attenuates the fitness of F11 within zebrafish.
The composition of traits (bottom KEY) represented among bacteria encoding homologues of (A) EcF11_3082, (C) EcF11_2628, or (E) EcF11_3933 are presented for the trait categories habitat of isolation, niche of isolation, phylum and phenotype. For reference, segmented outer rings bordering each pie graph depict the composition of traits of all genes contained within the TEA-MD. Equal numbers (1,000–2,000 CFU total) of wild type and (B) F11Δ3082, (D) F11Δ2628, or (F) F11Δ3933 were inoculated into the PC (left) or bloodstream (right) of embryos. Fish were sacrificed and bacterial counts determined ∼20 h post-inoculation by differential plating (n = 9 to 14 zebrafish). Dashed line marks the limit of quantification; p values were determined using a paired t-test, bars indicate medians.
Figure 7
Figure 7. Tn-seq and TEA-derived candidate genes promote the fitness of F11 within murine models of bacteremia and urinary tract infection.
Equal numbers (108 total CFU) of wild type F11 and (A) F11Δ3256, (B) F11Δ3082, (C) F11Δ2628, or (D) F11Δ3933, were subcutaneously injected into the nape of the neck of adult female Swiss Webster mice. Approximately 12 to 15 h later, bacterial titers within the spleen (left) and liver (right) were determined by differential plating. (E) Equal numbers (107 total CFU) of wild type F11 and F11Δ3933 were transurethrally inoculated into the urinary tract of adult female CBA/J mice. Bacterial titers present in the bladder (left) and kidneys (right) were determined 3 d post-inoculation by differential plating. Dashed line marks the limit of quantification. n = 7 to 14 mice; p values were determined using a paired t-test, bars indicate medians.

Similar articles

Cited by

References

    1. Ewers C, Janssen T, Wieler LH (2003) [Avian pathogenic Escherichia coli (APEC)]. Berliner und Munchener tierarztliche Wochenschrift 116: 381–395. - PubMed
    1. Shpigel NY, Elazar S, Rosenshine I (2008) Mammary pathogenic Escherichia coli. Current opinion in microbiology 11: 60–65. - PubMed
    1. Tan C, Xu Z, Zheng H, Liu W, Tang X, et al. (2011) Genome sequence of a porcine extraintestinal pathogenic Escherichia coli strain. Journal of bacteriology 193: 5038. - PMC - PubMed
    1. Carvallo FR, Debroy C, Baeza E, Hinckley L, Gilbert K, et al. (2010) Necrotizing pneumonia and pleuritis associated with extraintestinal pathogenic Escherichia coli in a tiger (Panthera tigris) cub. Journal of veterinary diagnostic investigation : official publication of the American Association of Veterinary Laboratory Diagnosticians, Inc 22: 136–140. - PubMed
    1. Foxman B (2010) The epidemiology of urinary tract infection. Nature reviews Urology 7: 653–660. - PubMed

Publication types

Substances