. 2013 Aug 26;8(8):e69257.
doi: 10.1371/journal.pone.0069257. eCollection 2013.

Tracking single cells in live animals using a photoconvertible near-infrared cell membrane label

Affiliations

Tracking single cells in live animals using a photoconvertible near-infrared cell membrane label

Alicia L Carlson et al. PLoS One. .

Erratum in

  • PLoS One. 2013;8(11). doi:10.1371/annotation/c05446df-ee55-4072-940c-543adff42086. Spencer, Joel A [added]

Abstract

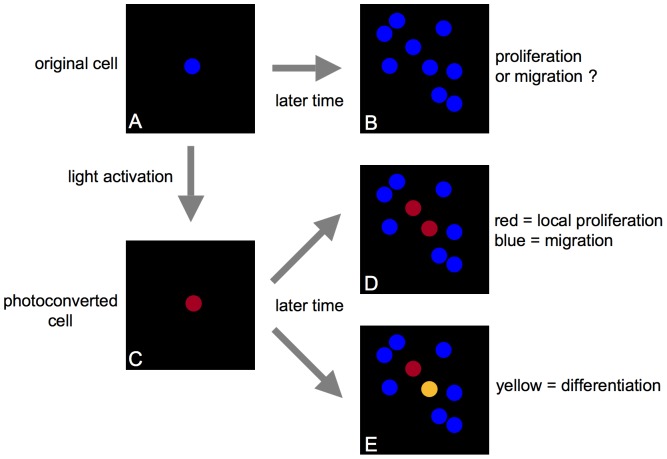
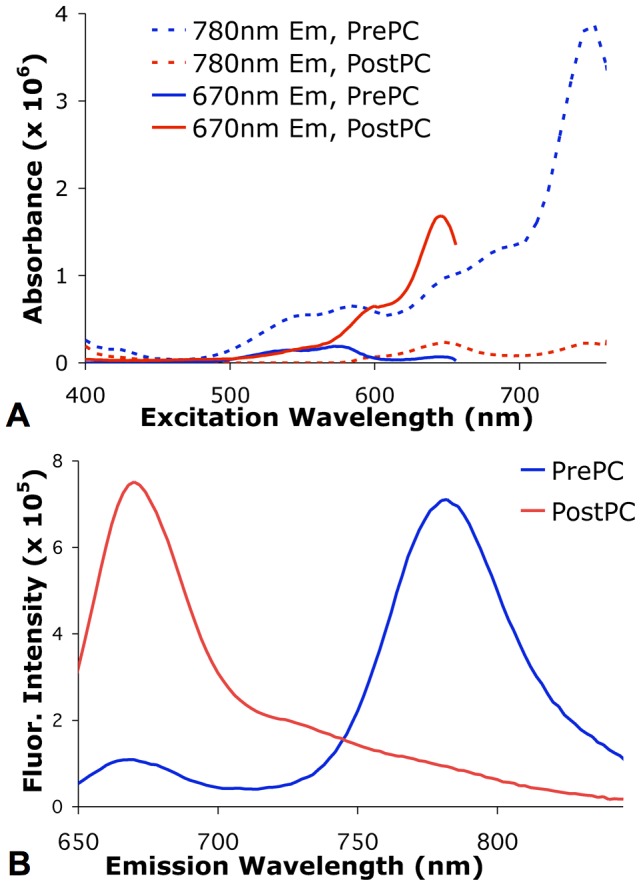
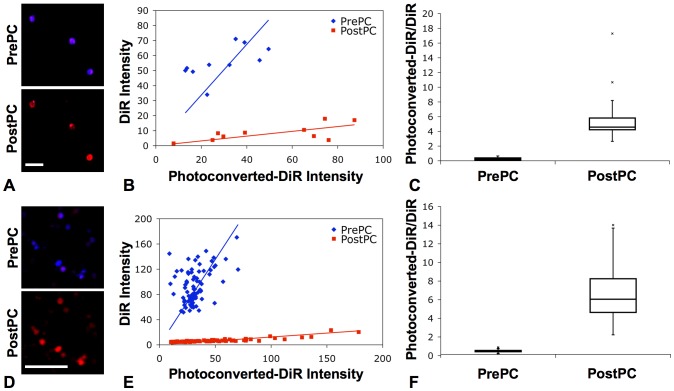
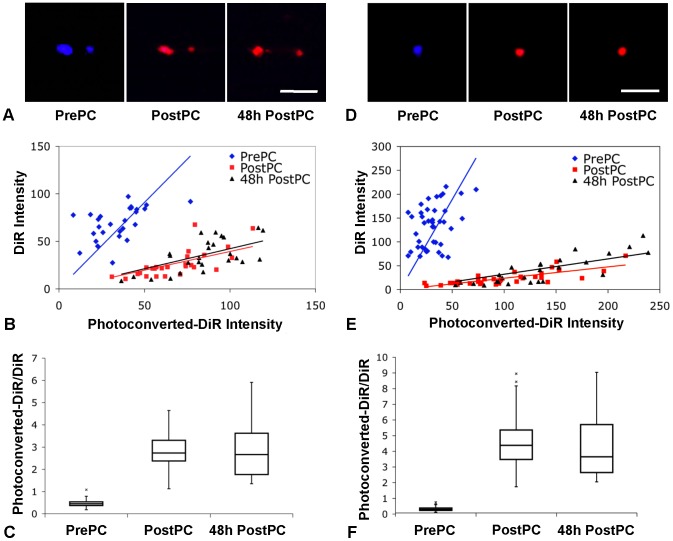
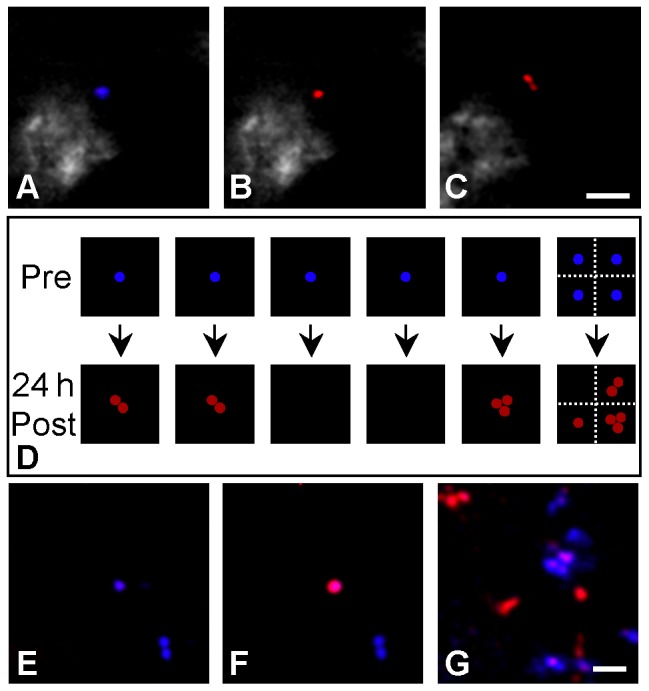
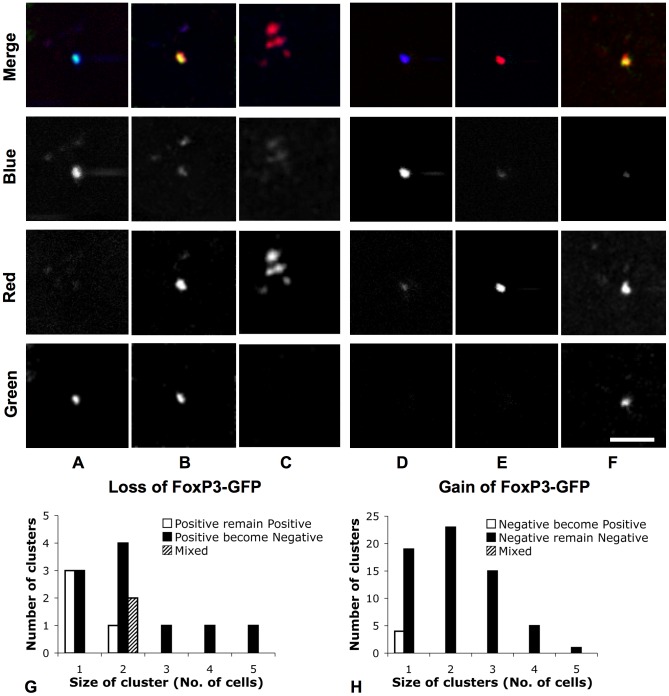
We describe a novel photoconversion technique to track individual cells in vivo using a commercial lipophilic membrane dye, DiR. We show that DiR exhibits a permanent fluorescence emission shift (photoconversion) after light exposure and does not reacquire the original color over time. Ratiometric imaging can be used to distinguish photoconverted from non-converted cells with high sensitivity. Combining the use of this photoconvertible dye with intravital microscopy, we tracked the division of individual hematopoietic stem/progenitor cells within the calvarium bone marrow of live mice. We also studied the peripheral differentiation of individual T cells by tracking the gain or loss of FoxP3-GFP expression, a marker of the immune suppressive function of CD4(+) T cells. With the near-infrared photoconvertible membrane dye, the entire visible spectral range is available for simultaneous use with other fluorescent proteins to monitor gene expression or to trace cell lineage commitment in vivo with high spatial and temporal resolution.


Conflict of interest statement

Competing Interests: The authors declare that no competing interests exist.

Figures

Figure 1
Figure 1. Schematic drawing of in vivo photoconversion method to track fate of a single cell.
(A) One DiR-labeled cell (blue circle) in the field of view. (B) Without photoconversion, when the same area is imaged at a later time point, additional DiR-labeled cells may be found in the same area, such that proliferation of the single cell viewed previously cannot be distinguished from new cell infiltration. (C) Photoconversion of the DiR-labeled cell (A, blue circle) changes its fluorescence emission (C, red circle), highlighting that cell so that it can be followed longitudinally to track its fate, including both cell division (D) as well differentiation when utilizing a fluorescent reporter gene to mark cell differentiation or function (E). During cell division, the progeny will retain the photoconverted fluorescence color (single red cell in (C) becomes two red cells in (D) through cell division). During differentiation, a photoconverted cell will change its fluorescence color when a reporter gene is turned on or off (red cell in (E) becomes yellow when GFP reporter is turned on).
Figure 2
Figure 2. DiR dye spectra before and after photoconversion.
(A) Fluorescence excitation spectra of DiR-labeled cells before (PrePC) and after (PostPC) photoconversion acquired at 670 nm and 780 nm emission. (B) Fluorescence emission spectra of DiR-labeled cells before (PrePC) and after (PostPC) photoconversion when excited at 632 nm, showing a significant shift in the fluorescence peak from 780 nm to 670 nm following photoconversion.
Figure 3
Figure 3. Ex vivo photoconversion of DiR-labeled cells.
(A) Fluorescence confocal images of ex vivo DiR-labeled HSPCs acquired before (PrePC) and after (PostPC) photoconversion (blue: DiR, 760–810 nm; red: photoconverted-DiR, 660–760 nm). Scale bar: 50 µm. (B) Plot of fluorescence intensity of ex vivo HSPCs before (PrePC) and after (PostPC) photoconversion for each individual cell. (C) Boxplot of the ratios of the photoconverted-DiR intensity to the DiR intensity, showing ability to photoconvert DiR-labeled stem and progenitor cells and to distinguish the change in the fluorescence intensity ratio after photoconversion (p = 8.36×10⁻⁴). (D) Fluorescence confocal images of ex vivo DiR-labeled T cells acquired before (PrePC) and after (PostPC) photoconversion (blue: DiR, >770 nm; red: photoconverted-DiR, 670–720 nm). Scale bar: 50 µm. (E) Plot of fluorescence intensity of ex vivo T cells before (PrePC) and after (PostPC) photoconversion. (F) Boxplot of the fluorescence intensity ratios, also showing ability to photoconvert DiR-labeled T cells and to distinguish the change in fluorescence after photoconversion (p = 1.15×10⁻³³).
Figure 4
Figure 4. In vivo photoconversion of DiR-labeled cells.
(A) In vivo fluorescence confocal images of DiR-labeled HSPCs acquired before (PrePC), immediately after (PostPC), and 48 h after (48 h PostPC) photoconversion within the skull BM of a live mouse (blue: DiR, >770 nm; red: photoconverted-DiR, 670–720 nm). Scale bar: 50 µm. (B) Plot of fluorescence intensity of in vivo HSPCs before (PrePC), immediately after (PostPC), and 48 h after (48 h PostPC) photoconversion for each individual cell. (C) Boxplot of the ratios of the photoconverted-DiR intensity to the DiR intensity, showing ability to photoconvert cells within the skull BM of live mice and to distinguish the change in the fluorescence intensity ratio after photoconversion (ppre-post = 7.72×10⁻¹⁴) as well as show the stability of the photoconversion in vivo over time (ppost-48hpost = 0.82). (D) In vivo fluorescence confocal images of DiR-labeled T cells acquired before (PrePC), immediately after (PostPC), and 48 h after (48 h PostPC) photoconversion within the skull BM of a live mouse (blue: DiR, >770 nm; red: photoconverted-DiR, 670–720 nm). Scale bar: 50 µm. (E) Plot of fluorescence intensity of in vivo T cells before (PrePC), immediately after (PostPC), and 48 h after (48 h PostPC) photoconversion. (F) Boxplot of the fluorescence intensity ratios showing ability to distinguish the change in fluorescence after photoconversion (ppre-post = 2.59×10⁻¹⁶) as well as show the stability of the photoconversion in vivo over time (ppost-48hpost = 0.94).
Figure 5
Figure 5. In vivo tracking of hematopoietic stem/progenitor cell proliferation.
Fluorescence confocal images of DiR-labeled HSPCs acquired in the skull BM of mice (A) before, (B) immediately after, and (C) 24 h after in vivo photoconversion (blue: DiR, >770 nm; red: photoconverted-DiR, 670–720 nm). Image (C) shows proliferation of the photoconverted cell. The drawing in figure (D) represents the results of tracking nine cells 24 h after photoconversion in six mice; each square represents one mouse. Series (E)–(G) demonstrates the ability to track HSPCs over long, discontinuous time periods by showing images acquired within the skull bone marrow (E) before, (F) immediately after, and (G) 135 h after in vivo photoconversion (blue: DiR, >770 nm; red: photoconverted-DiR, 670–720 nm). Scale bars: 50 µm.
Figure 6
Figure 6. In vivo tracking of FoxP3-GFP switching on and off in CD4+ T cells.
24 h after adoptive transfer of DiR-labeled FoxP3-GFP positive or negative T cells into RAG2−/− mice, T cells in skull BM were photoconverted and tracked longitudinally (blue: DiR, >770 nm; red: photoconverted-DiR, 670–720 nm; green: GFP, 509–547 nm). Series (A)–(C) shows that 48 h after photoconversion of DiR-labeled FoxP3-GFP-positive T cells (A: before photoconversion, blue+ red− green+; B: after photoconversion, blue− red+ green+), some photoconverted cells (24/30) turned off expression of FoxP3-GFP (C: blue− red+ green−), indicating that non-Tregs can be generated from Tregs in the BM. Series (D)–(F) shows that 48 h after photoconversion of DiR-labeled FoxP3-GFP-negative T cells (D: before photoconversion, blue+ red− green−; E: after photoconversion, blue− red+ green−), a small portion of photoconverted cells (4/113) expressed FoxP3-GFP (F: blue− red+ green+), indicating that FoxP3-GFP Tregs can be generated from FoxP3-GFP-negative T cells in the BM. Scale bar: 50 µm. Charts (G) and (H) show the number of clusters of FoxP3-GFP positive or negative cells 48 h after photoconversion. 20 of 25 FoxP3-GFP-negative cells, which derived from 19 FoxP3-GFP-positive cells, made clusters. All 4 FoxP3-GFP-positive cells derived from 88 FoxP3-GFP-negative cells remained singlets.

References

    1. Calvi LM, Adams GB, Weibrecht KW, Weber JM, Olson DP, et al. (2003) Osteoblastic cells regulate the haematopoietic stem cell niche. Nature 425: 841–846. - PubMed
    1. Kiel MJ, Yilmaz OH, Iwashita T, Terhorst C, Morrison SJ (2005) SLAM family receptors distinguish hematopoietic stem and progenitor cells and reveal endothelial niches for stem cells. Cell 121: 1109–1121. - PubMed
    1. Lo Celso C, Fleming HE, Wu JW, Zhao CX, Miake-Lye S, et al. (2009) Live-animal tracking of individual haematopoietic stem/progenitor cells in their niche. Nature 457: 92–96. - PMC - PubMed
    1. Zhang J, Niu C, Ye L, Huang H, He X, et al. (2003) Identification of the haematopoietic stem cell niche and control of the niche size. Nature 425: 836–841. - PubMed
    1. Komatsu N, Mariotti-Ferrandiz ME, Wang Y, Malissen B, Waldmann H, et al. (2009) Heterogeneity of natural Foxp3+ T cells: a committed regulatory T-cell lineage and an uncommitted minor population retaining plasticity. Proc Natl Acad Sci USA 106: 1903–1908. - PMC - PubMed

Publication types

MeSH terms