

A mathematical model of cancer stem cell driven tumor initiation: implications of niche size and loss of homeostatic regulatory mechanisms
- PMID: 23990931
- PMCID: PMC3747196
- DOI: 10.1371/journal.pone.0071128
A mathematical model of cancer stem cell driven tumor initiation: implications of niche size and loss of homeostatic regulatory mechanisms
Abstract
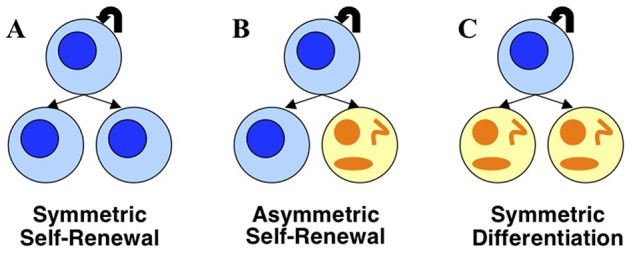
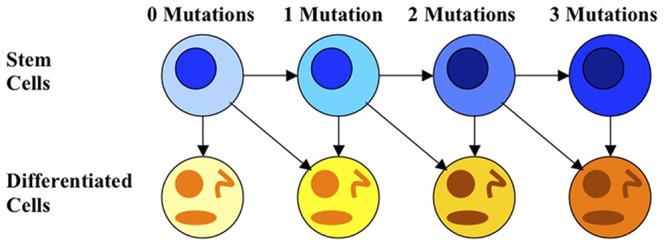
Hierarchical organized tissue structures, with stem cell driven cell differentiation, are critical to the homeostatic maintenance of most tissues, and this underlying cellular architecture is potentially a critical player in the development of a many cancers. Here, we develop a mathematical model of mutation acquisition to investigate how deregulation of the mechanisms preserving stem cell homeostasis contributes to tumor initiation. A novel feature of the model is the inclusion of both extrinsic and intrinsic chemical signaling and interaction with the niche to control stem cell self-renewal. We use the model to simulate the effects of a variety of types and sequences of mutations and then compare and contrast all mutation pathways in order to determine which ones generate cancer cells fastest. The model predicts that the sequence in which mutations occur significantly affects the pace of tumorigenesis. In addition, tumor composition varies for different mutation pathways, so that some sequences generate tumors that are dominated by cancerous cells with all possible mutations, while others are primarily comprised of cells that more closely resemble normal cells with only one or two mutations. We are also able to show that, under certain circumstances, healthy stem cells diminish due to the displacement by mutated cells that have a competitive advantage in the niche. Finally, in the event that all homeostatic regulation is lost, exponential growth of the cancer population occurs in addition to the depletion of normal cells. This model helps to advance our understanding of how mutation acquisition affects mechanisms that influence cell-fate decisions and leads to the initiation of cancers.
Conflict of interest statement
Figures
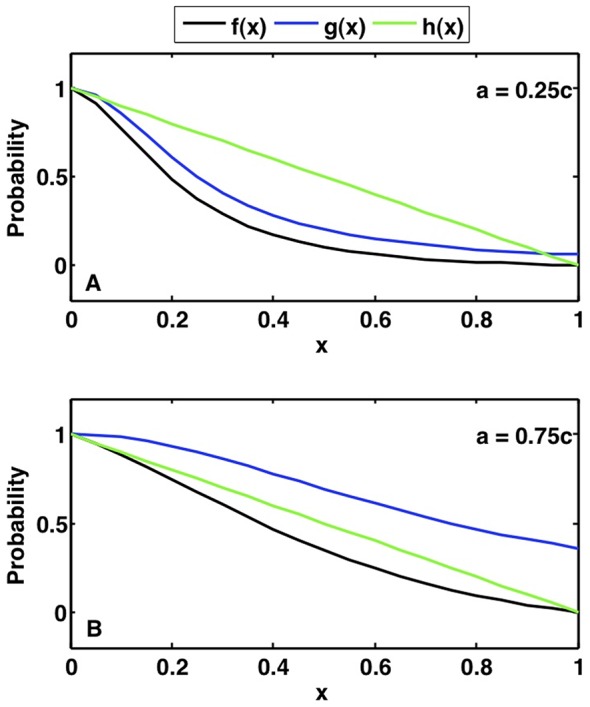
 , which takes into account both chemical interactions and niche control. Probability based solely on chemical signaling is given by function
  , and probability based solely on niche control is given by function
  .
.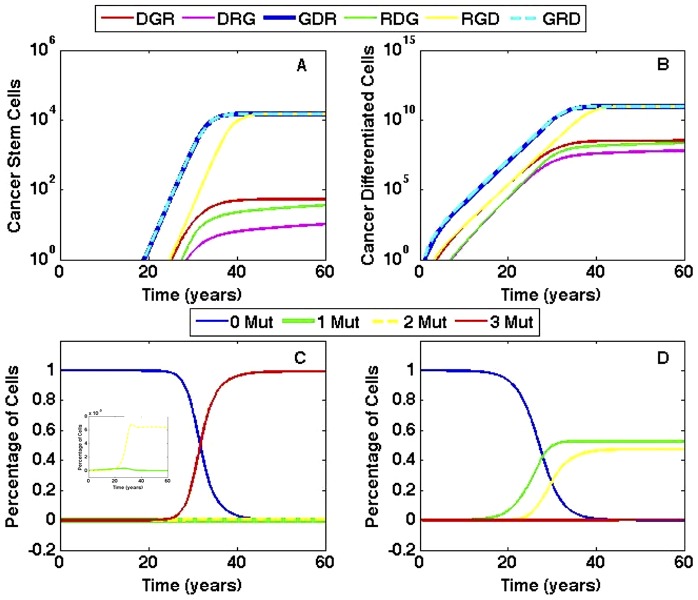
 ; cells with the D mutation have stem cell death rate
  = 0.025/day and differentiated cell death rate
  = 1.2/day; cells with the R mutation have stem cell proliferation rate
  = 0.07/day. (A) Cancer stem cells formed in each pathway are plotted versus time. The GDR pathway has the first cancer stem cell, followed very closely by the GRD pathway. (B) Differentiated cancer cells are plotted versus time for each pathway. The growth of differentiated cancer cells mirrors the growth of cancer stem cells in each pathway. (C) Tissue composition for the fastest pathway, GDR, versus time. The inset provides an expanded view of the percentage of cells with one and two mutations. (D) Tissue composition for the slowest pathway, DRG, versus time.
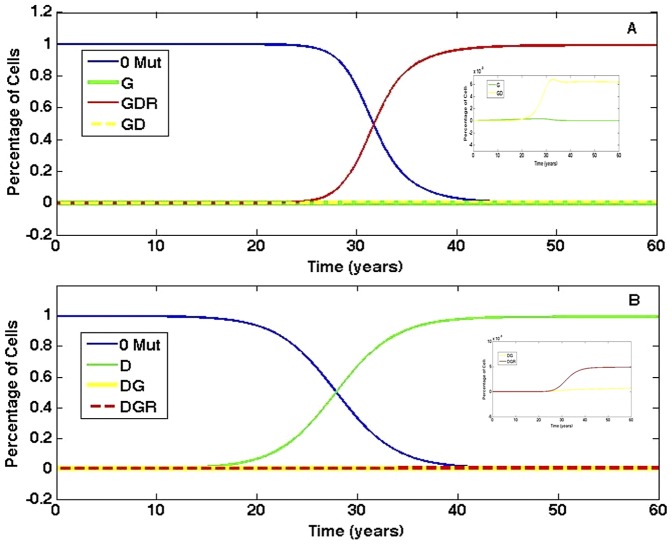
 ; cells with the D mutation have stem cell death rate
  = 0.025/day and differentiated cell death rate
  = 1.2/day; cells with the R mutation have stem cell proliferation rate
  = 0.07/day. The majority of tissue is eventually comprised of cells with all three mutations. The inset provides an expanded view of the percentage of cells with one and two mutations. (B) The tissue composition of the fastest pathway, DGR, when some mutations are lethal. Its tissue composition is strikingly different in that the majority of cells eventually have only one mutation and cancer cells are a small percentage of the tissue. Parameter values are the same as those in (A). The inset provides an expanded view of the percentage of cells with two and three mutations.
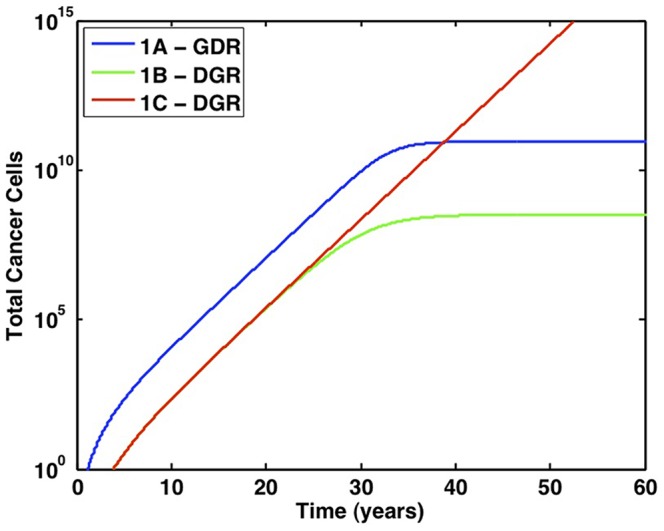
 ; cells with the R mutation have increased half-saturation constant,
  cells; cells with the D mutation have stem cell death rate
  = 0.025/day and differentiated cell death rate
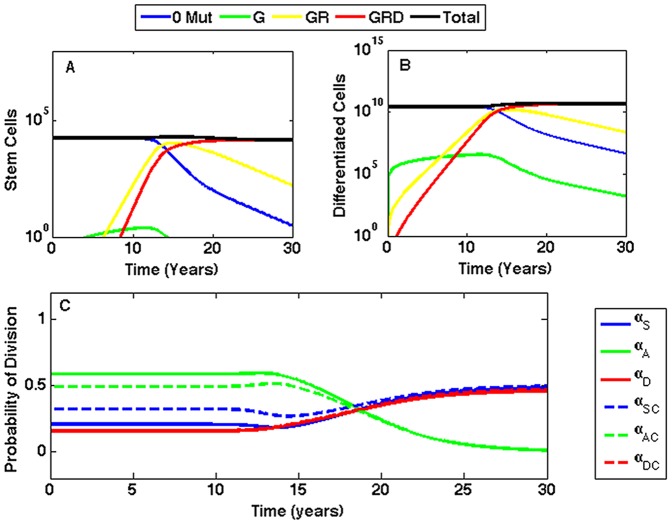
  = 1.2/day. (A) Stem cells versus time. The first cancer stem cell is formed in 8.44 years. (B) Differentiated cells versus time. (C) The probabilities for each type of stem cell division versus time. Probabilities for non-mutated cells are denoted
  ,
,  , and
, and  , and are plotted with solid lines; probabilities for cancer cells are denoted
  ,
,  , and
, and  , and are plotted with dashed lines.
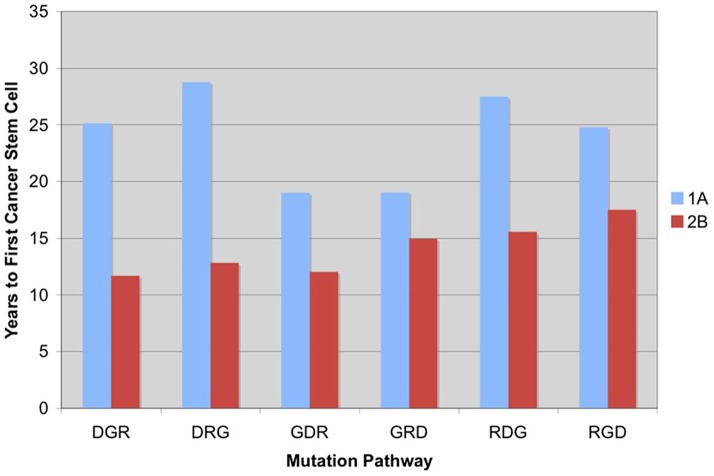
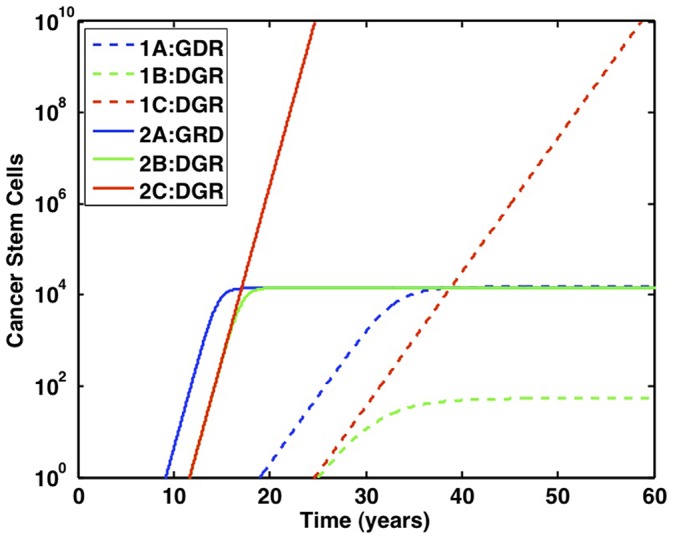
 = 0.07/day), are plotted with dashed lines. Case 2 simulations, in which symmetric self-renewal is increased (
 cells), are plotted with solid lines. For each case, A denotes when all mutations are advantageous, B denotes lethal mutations, and C denotes the loss of regulatory mechanisms. The first cancer stem cell is formed via the GDR pathway when symmetric self-renewal is increased and all mutations are advantageous. The most malignant growth is formed through the DGR pathway, when stem cells have increased symmetric self-renewal and have also lost feedback regulation.
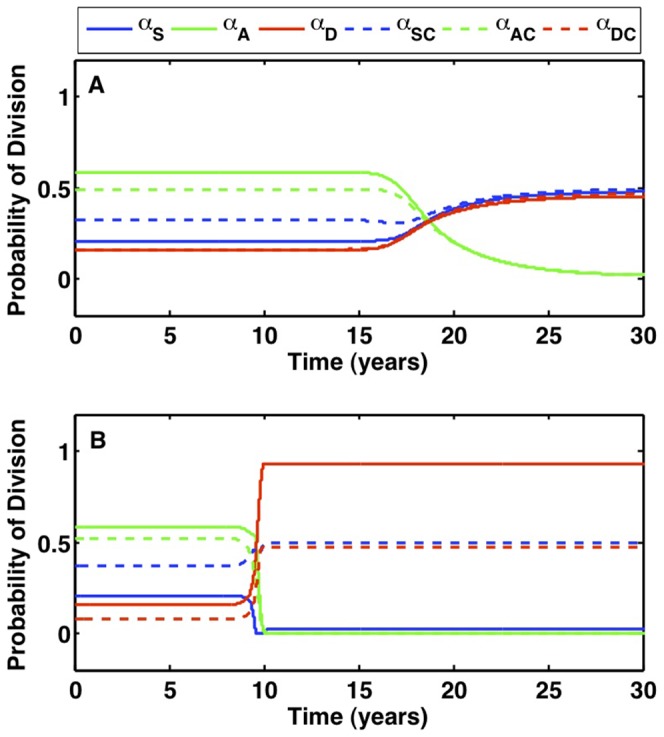
 cells. Both mutated and healthy cells approach balanced division patterns in the long run. (B) The probabilities of stem cell division when the R mutation doubles the niche size, such that
  . Normal cells are forced to differentiate due to crowding from the niche.
References
-
- Saeidpour S, Torabizadeh M (2013) Reviw on cancer stem cells. Int J LifeSc Bt Pharm Res 2 (1) 30–37.
-
- Passier R, Mummery C (2003) Origin and use of embryonic and adult stem cells in differentiation and tissue repairc. Cardiovas Res 58 (2) 324–355. - PubMed
-
- Morrison S, Kimble J (2006) Asymmetric and symmetric stem-cell divisions in development and cancer. Nature 441: 1068–1074. - PubMed
-
- Simons B, Cleavers H (2011) Strategies for homeostatic stem cell self-renewal in adult tissues. Cell 1454: 851–862. - PubMed
Publication types
MeSH terms
LinkOut - more resources
Full Text Sources
Other Literature Sources
