

Neglecting rice milling yield and quality underestimates economic losses from high-temperature stress
- PMID: 23991056
- PMCID: PMC3750041
- DOI: 10.1371/journal.pone.0072157
Neglecting rice milling yield and quality underestimates economic losses from high-temperature stress
Abstract
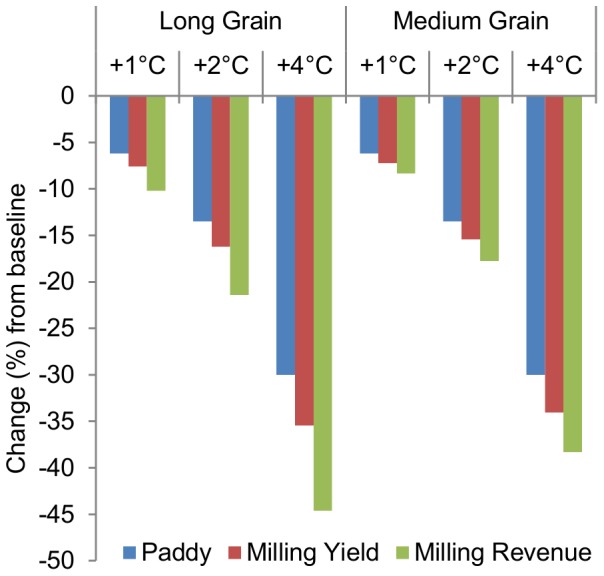
Future increases in global surface temperature threaten those worldwide who depend on rice production for their livelihoods and food security. Past analyses of high-temperature stress on rice production have focused on paddy yield and have failed to account for the detrimental impact of high temperatures on milling quality outcomes, which ultimately determine edible (marketable) rice yield and market value. Using genotype specific rice yield and milling quality data on six common rice varieties from Arkansas, USA, combined with on-site, half-hourly and daily temperature observations, we show a nonlinear effect of high-temperature stress exposure on yield and milling quality. A 1 °C increase in average growing season temperature reduces paddy yield by 6.2%, total milled rice yield by 7.1% to 8.0%, head rice yield by 9.0% to 13.8%, and total milling revenue by 8.1% to 11.0%, across genotypes. Our results indicate that failure to account for changes in milling quality leads to understatement of the impacts of high temperatures on rice production outcomes. These dramatic losses result from reduced paddy yield and increased percentages of chalky and broken kernels, which together decrease the quantity and market value of milled rice. Recently published estimates show paddy yield reductions of up to 10% across the major rice-producing regions of South and Southeast Asia due to rising temperatures. The results of our study suggest that the often-cited 10% figure underestimates the economic implications of climate change for rice producers, thus potentially threatening future food security for global rice producers and consumers.
Conflict of interest statement
Figures
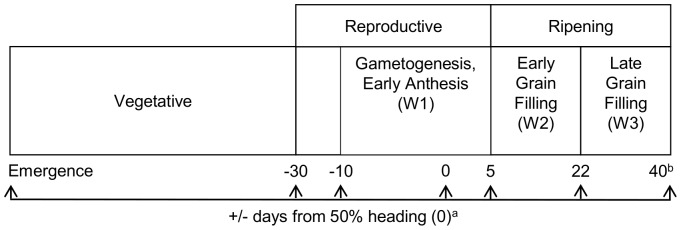
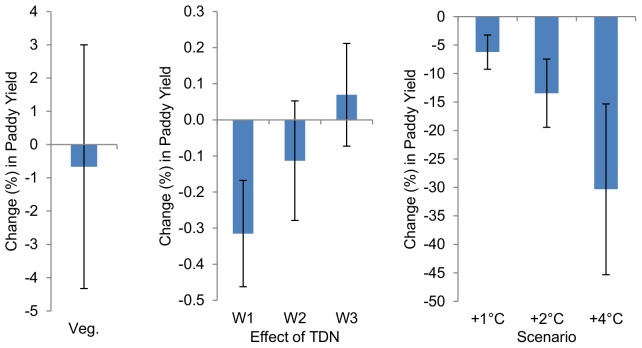
 on paddy yield. b, Marginal effects of an additional unit of high temperature exposure, TDN, during W1, W2, and W3. c, Response of mean paddy yield to 1°C, 2°C, and 4°C increases in average growing season temperature. Error bars indicate 95% confidence intervals calculated using heteroskedasticity robust standard errors.
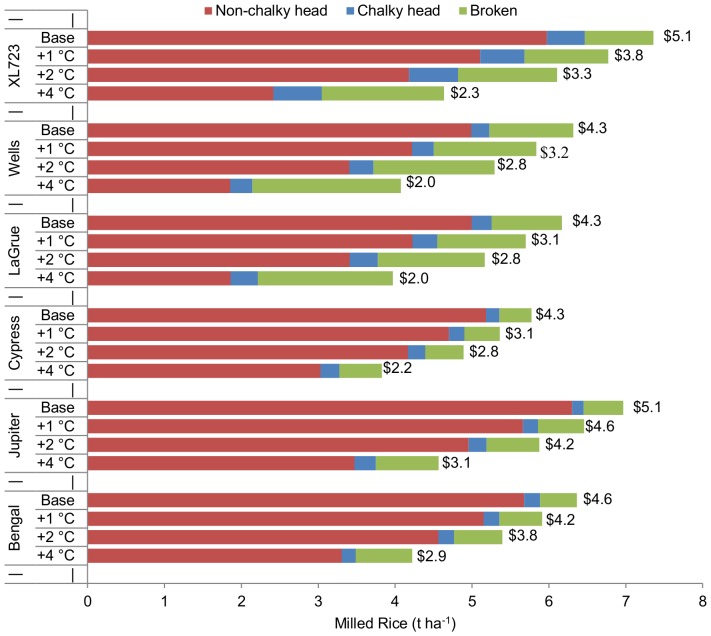
References
-
- Dawe D, Pandey S, Nelson A (2011) Emerging trends and spatial patterns of rice production. In: Rice in the Global Economy: Strategic Research and Policy Issues for Food Security (eds Pandey S, Byerlee D, Dawe D, et al.), International Rice Research Institute, Los Baños, Philippines.
-
- United Nations (2011) World Population Prospects: The 2010 Revision, Department of Social Affairs, Population Division, United Nations, New York, USA.
-
- FAO (2002) World Agriculture: Towards 2015/2030 Summary Report. FAO, Rome, Italy.
-
- GRiSP (2010) Summary, Global Rice Science Partnership, www.grisp.net/main/summary (accessed July 27, 2013).
-
- Wassmann R, Jagadish SVK, Heuer S, Ismail A, Redona E, et al. (2009) Climate change affecting rice production: the physiological and agronomic basis for possible adaptation strategies. Adv Agron 101: 59–122.
MeSH terms
LinkOut - more resources
Full Text Sources
Other Literature Sources
Miscellaneous
