. 2013 Aug 26;8(8):e72384.
doi: 10.1371/journal.pone.0072384. eCollection 2013.

Protein tyrosine phosphatase non-receptor type 22 modulates NOD2-induced cytokine release and autophagy

Affiliations

Protein tyrosine phosphatase non-receptor type 22 modulates NOD2-induced cytokine release and autophagy

Marianne R Spalinger et al. PLoS One. .

Abstract

Background: Variations within the gene locus encoding protein tyrosine phosphatase non-receptor type 22 (PTPN22) are associated with the risk to develop inflammatory bowel disease (IBD). PTPN22 is involved in the regulation of T- and B-cell receptor signaling, but although it is highly expressed in innate immune cells, its function in other signaling pathways is less clear. Here, we study whether loss of PTPN22 controls muramyl-dipeptide (MDP)-induced signaling and effects in immune cells.

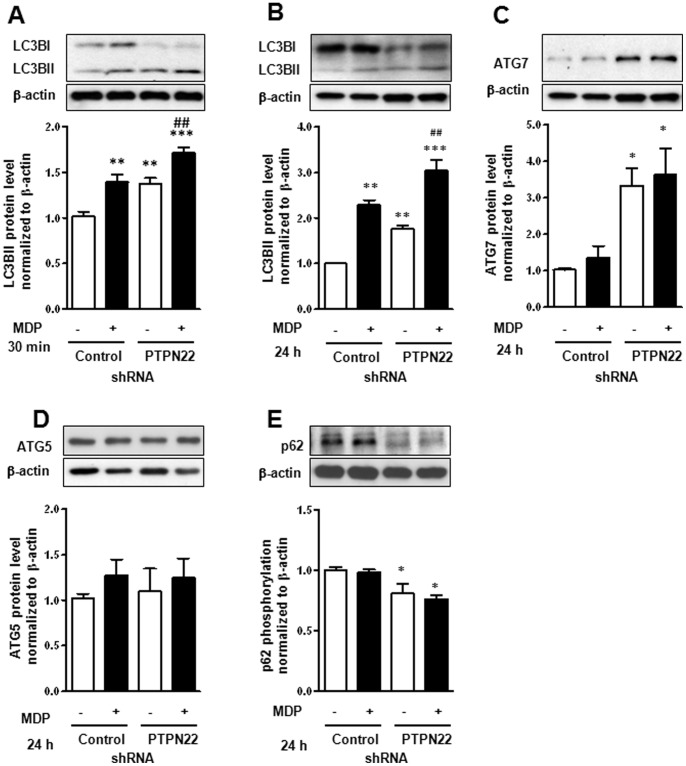
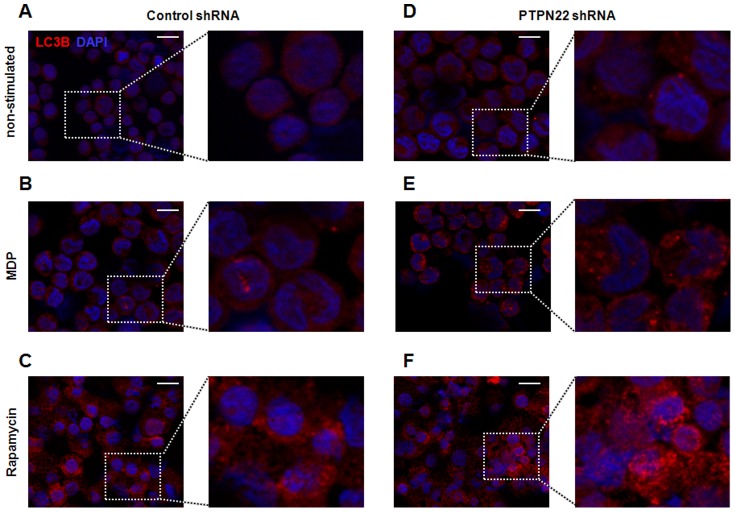
Material & methods: Stable knockdown of PTPN22 was induced in THP-1 cells by shRNA transduction prior to stimulation with the NOD2 ligand MDP. Cells were analyzed for signaling protein activation and mRNA expression by Western blot and quantitative PCR; cytokine secretion was assessed by ELISA, autophagosome induction by Western blot and immunofluorescence staining. Bone marrow derived dendritic cells (BMDC) were obtained from PTPN22 knockout mice or wild-type animals.

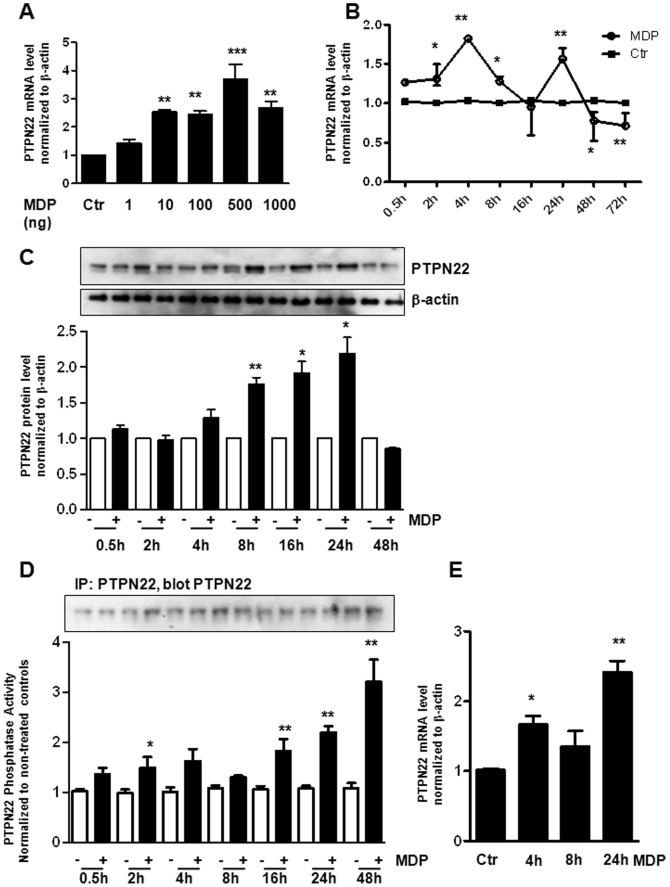
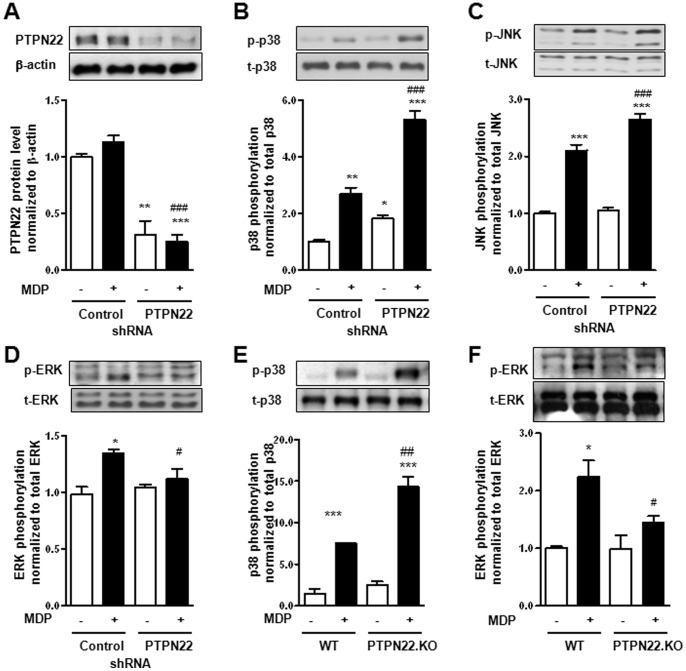
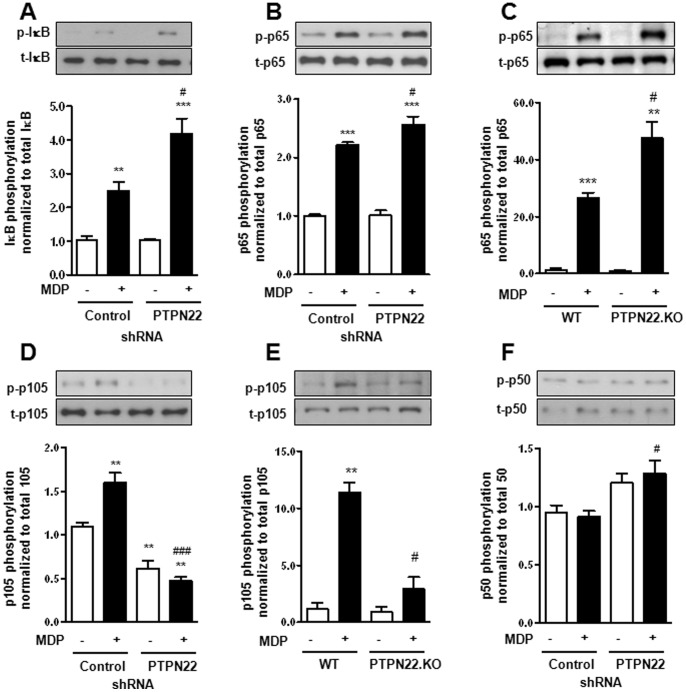
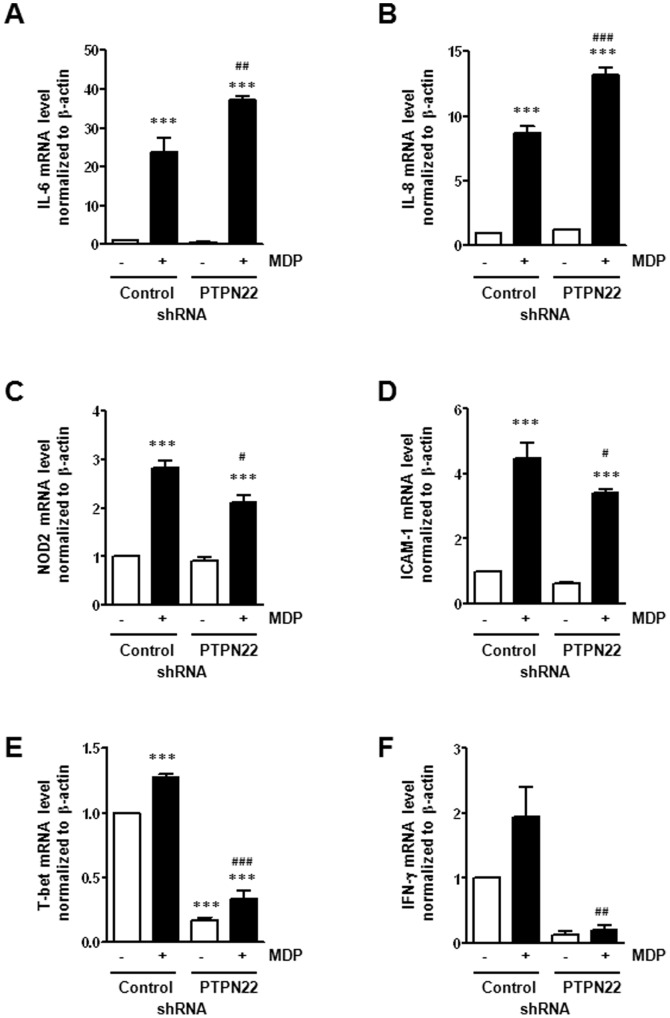
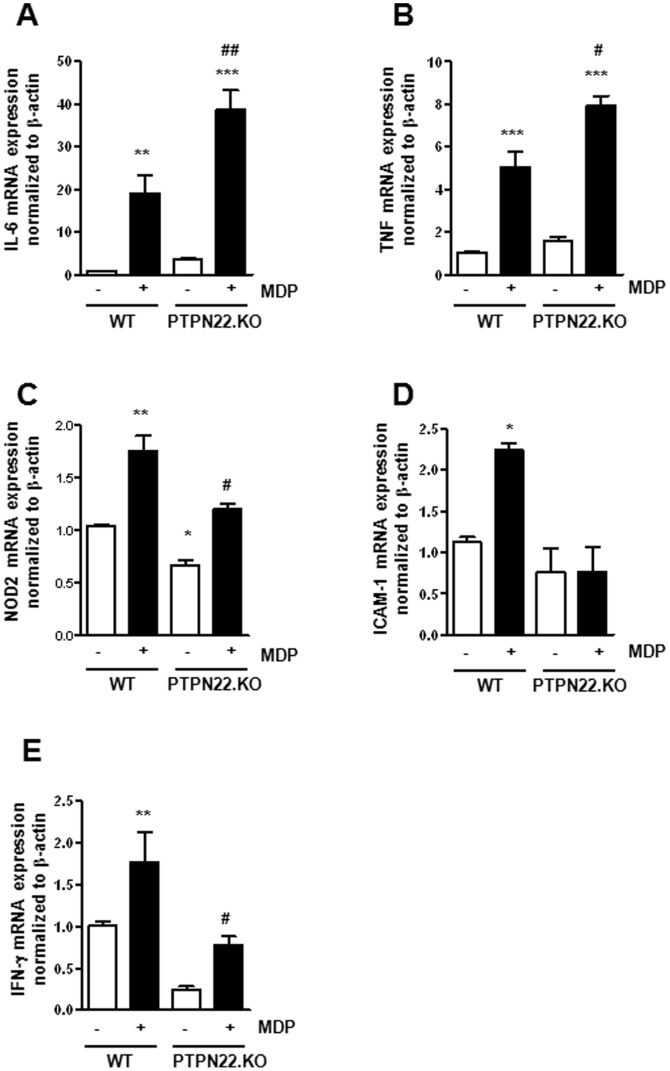
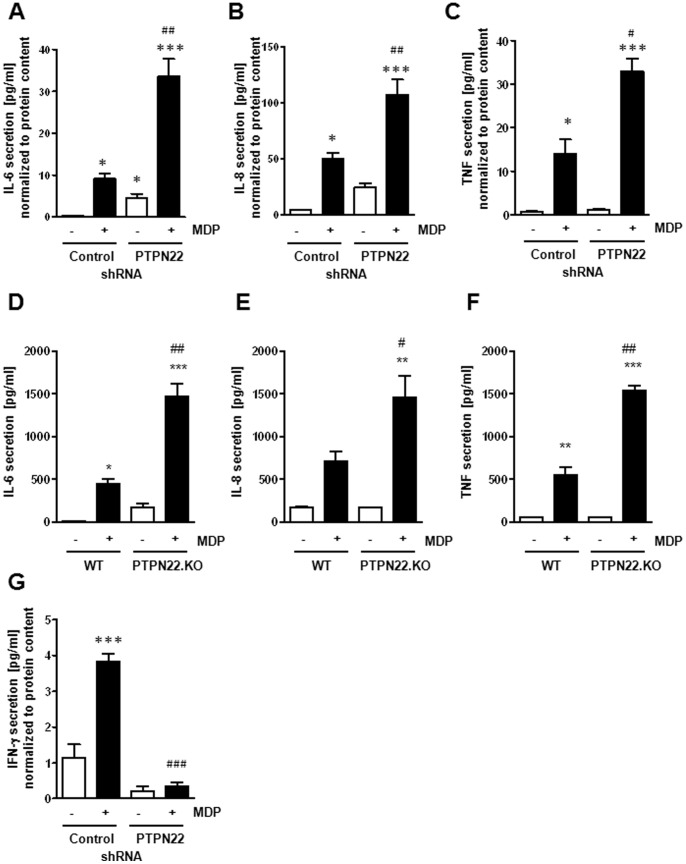
Results: MDP-treatment induced PTPN22 expression and activity in human and mouse cells. Knockdown of PTPN22 enhanced MDP-induced activation of mitogen-activated protein kinase (MAPK)-isoforms p38 and c-Jun N-terminal kinase as well as canonical NF-κB signaling molecules in THP-1 cells and BMDC derived from PTPN22 knockout mice. Loss of PTPN22 enhanced mRNA levels and secretion of interleukin (IL)-6, IL-8 and TNF in THP-1 cells and PTPN22 knockout BMDC. Additionally, loss of PTPN22 resulted in increased, MDP-mediated autophagy in human and mouse cells.

Conclusions: Our data demonstrate that PTPN22 controls NOD2 signaling, and loss of PTPN22 renders monocytes more reactive towards bacterial products, what might explain the association of PTPN22 variants with IBD pathogenesis.


Conflict of interest statement

Competing Interests: The authors have declared that no competing interests exist.

Figures

Figure 1
Figure 1. PTPN22 expression and activity is increased by MDP-treatment.
(A) THP-1 cells were treated with indicated amounts of MDP. The graph depicts relative PTPN22 mRNA levels normalized to β-actin and compared to non-treated controls. (B+C) THP-1 cells were treated with MDP (500 ng/ml) for increasing time. (B) The graph shows levels of PTPN22 mRNA normalized to β-actin and relative to non-treated control cells. (C) Representative Western blots show levels of PTPN22 expression and the loading control β-actin; the graph below depicts results of densitometric analysis (n = 3). (D) PTPN22 phosphatase activity normalized to PTPN22 content and relative to untreated controls (n = 3). Western blots above show PTPN22 amounts in the used precipitates. (E) BMDCs were treated for the indicated time with 500 ng/ml MDP. The graph shows levels of PTPN22 mRNA normalized to β-actin and relative to non-treated control cells. Asterisks denote significant differences from the respective controls (* = p<0.05, ** = p<0.01, *** = p<0.001).
Figure 2
Figure 2. Loss of PTPN22 enhances p38 and JNK MAPK phosphorylation.
A–D: THP-1 cells, expressing either non-targeting control shRNA or PTPN22 targeting shRNA, were treated for 30 min. with 500 ng/ml MDP. Representative Western blots and respective densitometric analysis show levels of (A) PTPN22 and β-actin; (B) phospho-p38 (Thr180/Tyr182) and total p38; (C) phospho-JNK (Thr183/Tyr185) and total JNK; (D) phospho-ERK (Tyr42/Tyr44) and total ERK. (E+F) BMDC from either wild type (WT) or PTPN22 knockout (PTPN22.KO) mice were stimulated for 30 min with 500 ng/ml MDP. Representative Western blots and densitometric analysis below show levels of (E) phospho-p38 (Thr180/Tyr182) and total p38; and (F) phospho-ERK (Tyr42/Tyr44) and total ERK. Asterisks denote significant differences from the respective control (n = 3 each, * = p<0.05, ** = p<0.01, *** = p<0.001); # = p<0.05, # = p<0.01, ### = p<0.001 vs. MDP-treatment of cells expressing control shRNA.
Figure 3
Figure 3. Knockdown of PTPN22 promotes canonical but not non-canonical NF-κB activation.
(A+B) THP-1 cells, expressing non-targeting control or PTPN22 specific shRNA, were treated for 30 min with 500 ng/ml MDP. Western blots and densitometric analysis below show levels of (A) phospho-IκB-α (Ser32) and total IκB-α; (B) phospho-NF-κB p65 (Ser536) and total NK-κB p65. (C) BMDC from either wild type (WT) or PTPN22 knockout (PTPN22.KO) mice were treated for 30 min with 500 ng/ml MDP. Representative Western blots and densitometric analysis below show levels of phospho-NF-κB p65 (Ser536) and total NK-κB p65. (D) THP-1 cells were treated as in A+B, Western blots and densitometric analysis show levels of phospho-NF-κB p105 (Ser933) and total NF-κB p105. (E) BMDC were treated as in (C); Western blot and densitometric analysis show levels of phospho-NF-κB p105 (Ser933) and total NF-κB p105. (F) THP-1 cells were treated as in A+B, Western blots and densitometric analysis show levels of phospho-NF-κB p50 (Ser933) and total NF-κB p50. Asterisks denote significant differences from the respective control (* = p<0.05, ** = p<0.01, *** = p<0.001); # = p<0.05, ### = p<0.001 vs. MDP-treatment of cells expressing control shRNA.
Figure 4
Figure 4. Changed mRNA expression upon knockdown of PTPN22.
THP-1 cells, expressing either control or PTPN22 specific shRNA, were treated 24 h with 500 ng/ml MDP. The graphs depict levels of (A) IL-6; (B) IL-8; (C) NOD2; (D) ICAM-1; (E) T-bet; or (F) IFN-γ mRNA normalized to β-actin and relative to non-treated control-shRNA expressing cells. Asterisks denote significant differences from the respective control (*** = p<0.001); # = p<0.05, # = p<0.001, ### = p<0.001 vs. MDP-treatment of cells expressing control shRNA.
Figure 5
Figure 5. Changed mRNA expression in BMDC lacking PTPN22.
BMDC from either wild-type (WT) or PTPN22 knockout (PTPN22.KO) mice, were treated 24 h with 500 ng/ml MDP. The graphs depict levels of (A) IL-6; (B) TNF; (C) NOD2; (D) ICAM-1; or (E) IFN-γ mRNA normalized to β-actin and relative to non-treated WT BMDC. Asterisks denote significant differences from the respective control (* = p<0.05, ** = p<0.01, *** = p<0.001); # = p<0.05, ## = p<0.001, vs. MDP-treatment of WT BMDC.
Figure 6
Figure 6. Loss of PTPN22 leads to changes in cytokine secretion.
(A–C) THP-1 cells, expressing non-targeting control or PTPN22 targeting shRNA, were treated for 24 h with 500 ng/ml MDP. The graphs show the secretion of (A) IL-6, (B) IL-8; or (C) TNF into the cell culture medium. (D–F) BMDC from WT or PTPN22 KO mice, were treated for 24 h with 500 ng/ml MDP and analysed for (D) IL-6, (E) IL-8; or (F) TNF secretion into the cell culture medium. (G) THP-1 cells were treated as in A–C; the graph shows levels of IFN-γ secretion. Values were shown in pg/ml and normalized to total protein content. Significant differences from the controls are denoted by asterisks (* = p<0.05, ** = p<0.01, *** = p<0.001); # = p<0.05, ## = p<0.01, ### = p<0.001 vs. MDP-treated control-transduced cells.
Figure 7
Figure 7. Autophagy is enhanced upon PTPN22 knockdown.
THP-1 cells were treated for the indicated time with 500 ng/ml MDP. Western blots and results of densitometric analysis in the graphs below show levels of (A+B) LC3BI+II and β-actin; (C) ATG7 and β-actin; (D) ATG5 and β-actin; or (E) p62 and β-actin. Significant differences from the controls are denoted by asterisks (* = p<0.05, ** = p<0.01, *** = p<0.001); ## = p<0.01 vs. MDP-treated control-transduced cells.
Figure 8
Figure 8. Loss of PTPN22 promotes the formation of autophagosomes.
THP-1 cells, expressing either non-targeting control shRNA (A–C), or PTPN22 targeting shRNA (D–F) were left untreated, treated for 24 h with 500 ng/ml MDP or 100 nM rapamycine and stained for LC3B (red) and DAPI (blue). Representative pictures are shown for (A) non-treated cells expressing control shRNA, (B) MDP-treated cells expressing control shRNA, (C) Rapamycine-treated cells expressing control shRNA, (D) non-treated cells expressing PTPN22 shRNA, (E) MDP-treated cells expressing PTPN22 shRNA; and (F) Rapamycine-treated cells expressing PTPN22 shRNA. Scale bar: 10 µm.

Similar articles

Cited by

References

    1. Rogler G, Hausmann M, Vogl D, Aschenbrenner E, Andus T, et al. (1998) Isolation and phenotypic characterization of colonic macrophages. Clin Exp Immunol 112: 205–215. - PMC - PubMed
    1. Chen G, Shaw MH, Kim YG, Nunez G (2009) NOD-like receptors: role in innate immunity and inflammatory disease. Annu Rev Pathol 4: 365–398. - PubMed
    1. Girardin SE, Boneca IG, Viala J, Chamaillard M, Labigne A, et al. (2003) Nod2 is a general sensor of peptidoglycan through muramyl dipeptide (MDP) detection. J Biol Chem 278: 8869–8872. - PubMed
    1. Ogura Y, Bonen DK, Inohara N, Nicolae DL, Chen FF, et al. (2001) A frameshift mutation in NOD2 associated with susceptibility to Crohn's disease. Nature 411: 603–606. - PubMed
    1. Hugot JP, Chamaillard M, Zouali H, Lesage S, Cezard JP, et al. (2001) Association of NOD2 leucine-rich repeat variants with susceptibility to Crohn's disease. Nature 411: 599–603. - PubMed

Publication types

MeSH terms

Substances