Review
. 2014 Apr;171(8):2099-122.
doi: 10.1111/bph.12369.

Regulation of mitochondrial bioenergetic function by hydrogen sulfide. Part I. Biochemical and physiological mechanisms

Affiliations
Review

Regulation of mitochondrial bioenergetic function by hydrogen sulfide. Part I. Biochemical and physiological mechanisms

Csaba Szabo et al. Br J Pharmacol. 2014 Apr.

Abstract

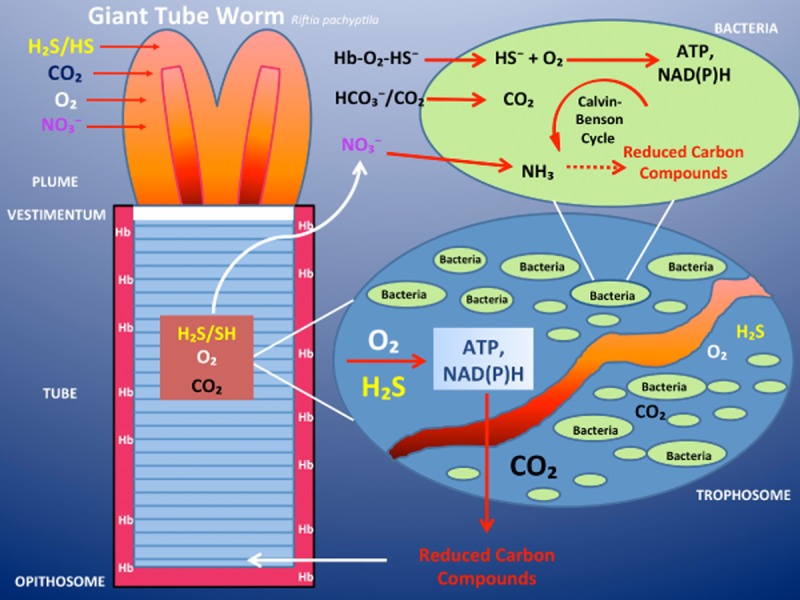
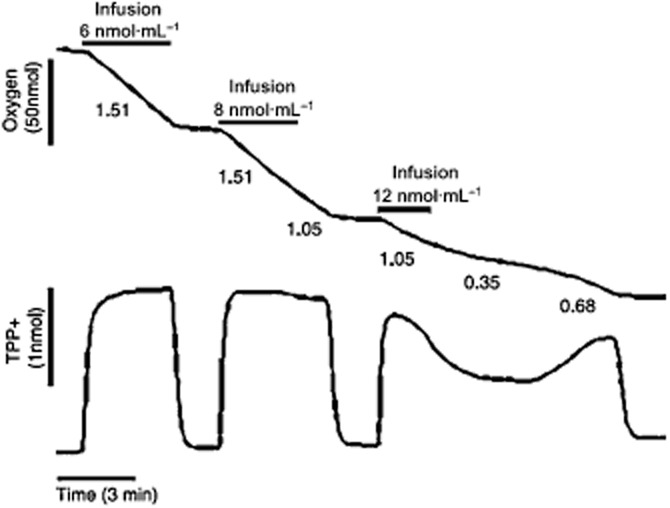
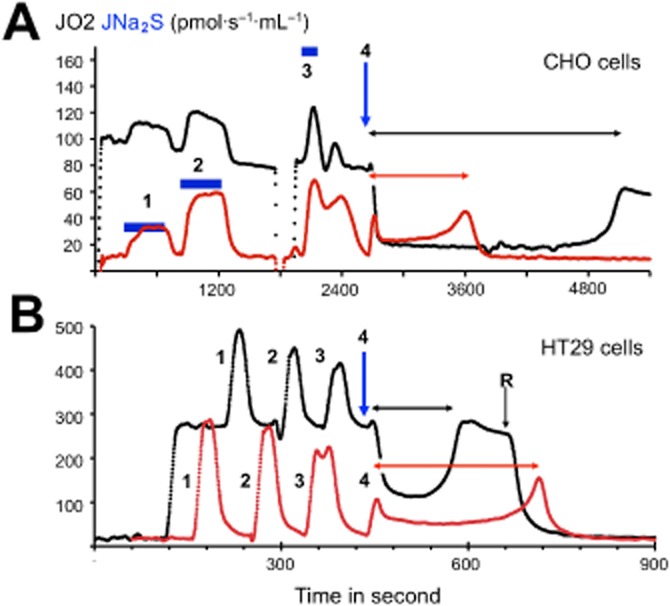
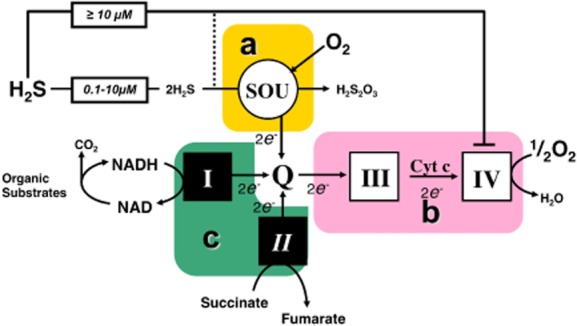
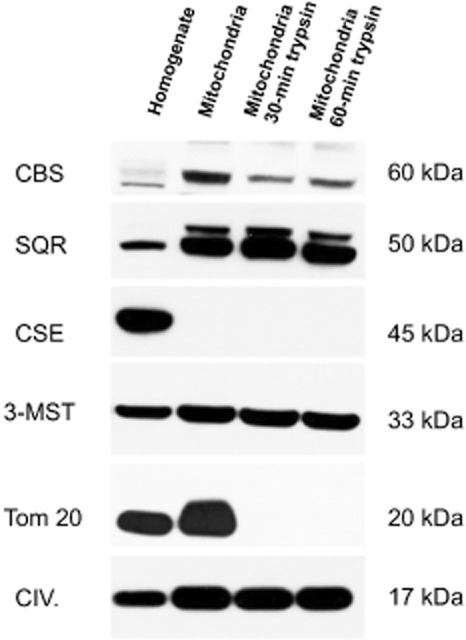
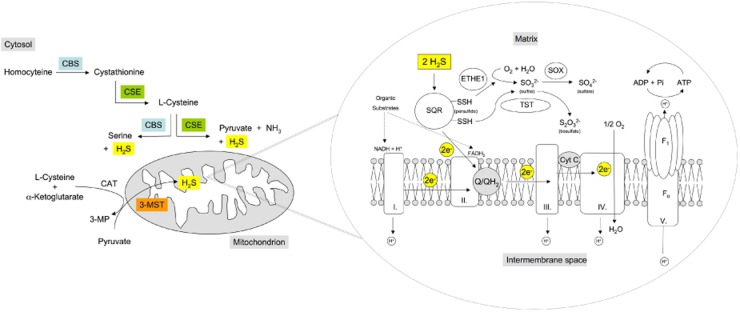
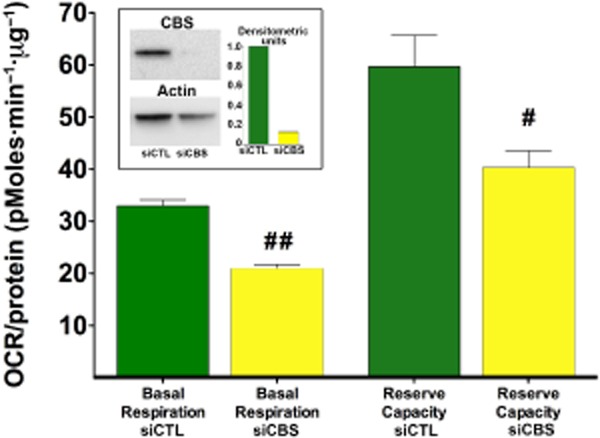
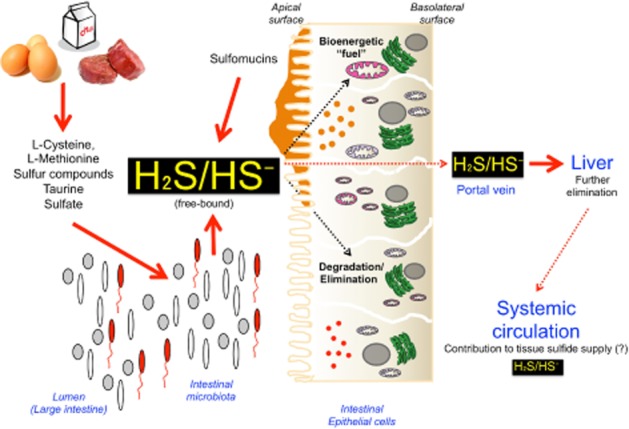
Until recently, hydrogen sulfide (H2 S) was exclusively viewed a toxic gas and an environmental hazard, with its toxicity primarily attributed to the inhibition of mitochondrial Complex IV, resulting in a shutdown of mitochondrial electron transport and cellular ATP generation. Work over the last decade established multiple biological regulatory roles of H2 S, as an endogenous gaseous transmitter. H2 S is produced by cystathionine γ-lyase (CSE), cystathionine β-synthase (CBS) and 3-mercaptopyruvate sulfurtransferase (3-MST). In striking contrast to its inhibitory effect on Complex IV, recent studies showed that at lower concentrations, H2 S serves as a stimulator of electron transport in mammalian cells, by acting as a mitochondrial electron donor. Endogenous H2 S, produced by mitochondrially localized 3-MST, supports basal, physiological cellular bioenergetic functions; the activity of this metabolic support declines with physiological aging. In specialized conditions (calcium overload in vascular smooth muscle, colon cancer cells), CSE and CBS can also associate with the mitochondria; H2 S produced by these enzymes, serves as an endogenous stimulator of cellular bioenergetics. The current article overviews the biochemical mechanisms underlying the stimulatory and inhibitory effects of H2 S on mitochondrial function and cellular bioenergetics and discusses the implication of these processes for normal cellular physiology. The relevance of H2 S biology is also discussed in the context of colonic epithelial cell physiology: colonocytes are exposed to high levels of sulfide produced by enteric bacteria, and serve as a metabolic barrier to limit their entry into the mammalian host, while, at the same time, utilizing it as a metabolic 'fuel'.

Keywords: 3-mercaptopyruvate sulfurtransferase; bioenergetics; blood vessels; cysteine; cytochrome c oxidase; free radicals; gasotransmitters; mitochondrial electron transport; nitric oxide; superoxide.


Figures

Figure 1
Figure 1
Suppression or enhancement of cellular viability by H2S, depending on the degree of oxidative stress. Murine J774.2 macrophages were grown in culture as described (Szoleczky et al., 2012) and exposed to various concentrations (0.3–3 mM) of hydrogen peroxide (H2O2) in the presence or absence of a 15-min pretreatment with various concentrations of the H2S donor NaHS (1–50 mM). At 5 h, cellular viability was measured by the lactate dehydrogenase (LDH) release method and mitochondrial activity was measured by the MTT (3-[4,5-dimethylthiazol-2-yl]-2,5-diphenyltetrazolium) method, as described (Szabo et al., ; Szoleczky et al., 2012). (This method largely measures the activity of mitochondrial succinate dehydrogenase, but it is also used as a general index of cell viability.) Note the concentration-dependent suppression of mitochondrial respiration and loss of cell viability by high concentrations of sulfide, and the protective effect of the same concentrations of sulfide in the presence of severe oxidative stress elicited by H2O2. Data are mean ± SEM of n = 6. *P < 0.05 represent significant protection by 3–30 mM H2S against 3 mM H2O2 exposure (anova, followed by Tukey's post hoc test).
Figure 2
Figure 2
Inhalation toxicity with H2S results in a preferential inhibition of Complex IV activity in the lung ex vivo. Data show the activities of various lung mitochondrial respiratory chain enzymes following a 4-h inhalational exposure of Fischer-344 rats to various concentrations of H2S. Lungs were prepared freshly, mitochondria were prepared via differential centrifugation and mitochondrial enzyme activities were determined at saturating substrate concentrations (Khan et al., 1990). Briefly, cytochrome c oxidase activity was assayed according to the procedure of Wharton and Tzagoloff (1967) with the following modifications. The assay contained potassium phosphate buffer, pH 7.0 (10 mM), ferrocytochrome c (50 μM), distilled water and mitochondrial suspension. Except for the mitochondrial fraction, all other assay components were pre-incubated for 1 min in a spectrophotometric cuvette. Enzyme activity was measured by rapidly mixing in the mitochondrial suspension and monitoring the decrease in optical density at 550 nm. The rate of decrease during the initial 30 set was used in the calculation of enzyme activity. NADH-cytochrome c reductase and succinate-cytochrome c reductase activities and succinate oxidase activity were measured by the methods described by Mustafa et al. (1977). All assays were conducted at 25°C, except, because of low activity of succinate oxidase in lung mitochondria, this enzyme was assayed at 37°C. Data are shown as mean ± SD of n = 4–6 animals in each group. *P < 0.05 and **P < 0.01 represent significant inhibition of enzyme activity at the indicated concentration of H2S. The figure represents a recalculation and replotting of previously published data by Khan et al. (1990); the guidelines of the Canadian Council for Animal Care were followed in all animal experimentations.
Figure 3
Figure 3
Inhibition of cytochrome c oxidase by H2S in vitro. (A) The effect on the oxygen kinetics of various concentrations of sulfide: 0.32, 0.22 and 0.12 μM is shown on bovine heart cytochrome c oxidase activity. The medium contained 23 mM ascorbate, 68 μM cytochrome c, 34 nM cytochrome aa3, 67 mM potassium phosphate, 1 mM EDTA, 0.5% Tween-80, pH 7.4, 25°C. Sulfide binding was allowed under turnover conditions as described (Petersen, 1977). The respiration rate as a function at the oxygen concentration was calculated and plotted as Lineweaver–Burk plots. The figure represents a replotting of previously published experiments by Petersen (1977). (B) Inhibition of cytochrome c oxidase by H2S is enhanced by mild acidosis in vitro. The activity of cytochrome c oxidase (Sigma, St. Louis, MO, USA) was measured in rat liver mitochondrial homogenates using the CYTOCOX1 cytochrome c oxidase kit (Sigma) according to the manufacturer's instructions in the presence of H2S generated by NaHS (1 and 20 μM) at two different pH levels, 7.4 (neutral) and 6.8 (moderate acidosis). While the basal activity of the enzyme was unaffected by pH, the inhibitory effect of sulfide was potentiated by acidosis. Mean ± SEM of n = 3 is shown; *P < 0.05 shows significant enhancement of the inhibitory effect of sulfide in acidosis (Student's t-test). The animal experimentation component of the studies was conducted with the approval of the Animal Care and Use Committee (IACUC) of the University of Texas Medical Branch and according to the applicable guidelines of the National Institute of Health.
Figure 4
Figure 4
Mechanisms of inhibition of cytochrome c oxidase by H2S. (A) Active site structures of cytochrome C oxidase (CcO, top) and its synthetic model (Fe Cu and phenol analogue) used to study the mechanism of its inhibition by sulfide (Collman et al., 2009). (B) Schematic representation of the possible roles of H2S affecting CcO activity, as derived from the synthetic model shown in part A. The box indicates that H2S binds to the reduced CcO active site, but can be subsequently replaced by O2. This inhibition is hypothesized to occur at moderate H2S concentrations. At lower concentrations, H2S does not compete with the substrate O2 but can still reduce CcO's active site and/or cytochrome c (Cytc) during catalytic O2 reduction. From Collman et al. (2009), reproduced by permission.
Figure 5
Figure 5
H2S is a source of energy for the tubeworm living in the oxygen-poor but sulfide-rich environment of deep-sea hydrothermal vents. Schematic illustration of the anatomical and physiological organization of the vestimentiferan tubeworm Rijiia pachypeila. The animal is anchored inside its protective tube by the vestimentum. At its anterior end is a respiratory plume. Behind the vestimentum is a region that makes up the bulk of the worm, the trunk. Inside the trunk is the trophosome, which consists primarily of symbiont containing bacteriocytes, associated cells and blood vessels. At the posterior end of the worm is a short region (opisthosome), which anchors the base of the worm to its tube. Oxygen, sulfide (most likely in the form of HS), nitrate and carbon dioxide are absorbed through the plume and transported in the blood to the cells of the trophosome. Sulfide, such as oxygen, is bound to the sulfide-binding protein, the worm's haemoglobin, and carried to the symbionts. These tubeworm haemoglobins are capable of carrying oxygen in the presence of sulfide, without being ‘poisoned’ by it. The symbionts oxidize the sulfide and use some of the energy released to drive the Calvin-Benson cycle of net CO2 fixation. Some fraction of the reduced carbon compounds synthesized by the symbionts is translocated to the animal host. Furthermore, the chemosynthetic bacteria within the trophosome are able to convert nitrate to ammonium ions, which then become available for the production of amino acids by the bacteria. Later these organic nitrogen-containing compounds are also released to the tubeworm. Modified after Gaill (1993).
Figure 6
Figure 6
Mammalian cells consume H2S, leading to mitochondrial energization in HT-29 cells. To simultaneously study the mitochondrial bioenergetics (respiration) and membrane potential in colonocytes, permeabilized HT29 cells were used. Approximately 5 × 10⁶ HT29 cells were resuspended in 1.5 mL of the permeabilization medium for this experiment. Top tracing: oxygen concentration; bottom tracing: TPP+ uptake (proportional to membrane potential) are plotted versus time. Sulfide infusions are indicated by horizontal bars above the oxygen tracing, with the rate of infusion shown. Respiration rates (nanomoles of O2/minute/million cells) are shown under the O2 tracing. Infusion of sulfide causes O2 consumption by the permeabilized cells. This is accompanied by an immediate increase in membrane potential as judged from the TPP+ uptake. Both responses can be blocked by antimycin and myxothiazol, which are known inhibitors of the Complex III (coenzyme Q – cytochrome c reductase) of the mitochondrial respiratory chain (not shown). Reproduced with permission from Goubern et al. (2007).
Figure 7
Figure 7
Comparison of CHO cells and colonocytes reveals reverse bioenergetics in presence of high sulfide. The experiments shown were made with a O2k apparatus equipped with the TiP injection pumps. A stock solution of 1 M Na2S was prepared each day and diluted at 5 mM to load in the glass syringes of the injection pump. CHO cells (top) or HT29 cells (immortalized human colonocytes derived from colon cancer) were subject to addition of sulfide during normal respiration (black trace) or in presence of the Complex I inhibitor rotenone (red trace) that inhibits almost completely the cellular respiration. (A) CHO cell line resuspended at 2 × 10⁶ cells·mL−1, the additions 1, 2 and 3 were infusions of sulfide for the time indicated by the black horizontal bars at different increasing rates (same Y ordinate as oxygen consumption). During additions 2, 3 and 4, the same quantity of sulfide was administered at a rate matching with (2) or significantly higher than (3) the cellular capacity for sulfide oxidation, or in a single fast addition (4) final concentration 26 μM (thick black arrow downward). (B) HT29 cells (4–6 × 10⁶ cells·mL−1) additions 1, 2 and 3 were repeated, leading to 25 μM final sulfide concentration. The injection 4 (thick black arrow downward) increased sulfide concentration to 50 μM. This sequence of four injections was repeated twice firstly in absence and secondly after rotenone addition indicated as ‘R’. In order to permit direct comparison, these two successive sequences of additions are shown superposed. In the absence of rotenone, the last sulfide addition (4) produced in both cell types a significant inhibition of cellular oxygen consumption (a reversible effect). In the presence of rotenone, the same addition produced a submaximal increase of oxygen consumption when compared to previous additions. This rate increased in a non-linear way, with time reaching its maximum short time before sulfide exhaustion, revealing a progressive loss of inhibition as oxidation proceeds. With the CHO cells, the time necessary to reverse the inhibition of cellular respiration (horizontal double headed black arrow) was significantly longer than the time to consume all sulfide when mitochondrial Complex I was inhibited by rotenone (horizontal double headed grey arrow). The explanation of this observation is that under conditions of inhibition the reduction state of the NADH/NAD redox couple increases dramatically and renders the Complex I a strong competitor for SOU. In contrast, with colonocytes the opposite is observed (compare horizontal arrows), as if inhibition of Complex I, in fact, lowered the rate of sulfide oxidation. This observation can be explained by a model where Complex I operates in a reverse mode (accepts electrons from quinone to reduce NAD into NADH), which, in turn, helps sulfide oxidation, rather than to antagonize it.
Figure 8
Figure 8
The Sulfide Oxidation Unit (SOU), and limiting steps for sulfide oxidation. Complexes of the mitochondrial respiratory chain are numbered with roman numerals. Three essential blocks of reactions important for the control of sulfide oxidation ‘a, b, c’ are boxed: ‘a’ is the SOU, which oxidizes two molecules of sulfide, uses one dioxygen molecule, releases thiosulfate (H2S2O3) and reduces quinone ‘Q’. ‘b’ accepts electrons from quinone and drives them through Complexes III and IV to oxygen. The sequential intervention of ‘a’ and ‘b’ is necessary for sulfide oxidation to proceed. 1.5 molecules of dioxygen and two molecules of H2S are used: the stoichiometry is thus 1.5/2 = 0.75. Complex IV is the target of sulfide inhibition, which becomes significant at 10 μM and above, while the SOU could operate well below this 10 μM concentration. Block ‘c’ is constituted by the other enzymatic reactions, reducing quinone and is a competitor of SOU. Mitochondrial Complex V (not shown in the scheme) imposes collectively to a, b, c, the constraint of respiratory control matching the flux through the redox reactions (a, b, c) to values imposed by the ATP turnover rate.
Figure 9
Figure 9
Fast cellular oxidation of sulfide in the nanomolar range. The human monocyte cell line THP1 (top) and a CHO cell line (2 × 106 cells·mL−1) expressing human SQR (bottom) were used in these experiments aiming to demonstrate that sulfide oxidation could take place when external sulfide concentration is in the nanomolar range. The experiments were made with an ‘Oroboros O2k’ apparatus equipped with the TiP injection pumps a stock solution of 1 M Na2S was prepared each day and diluted at 5 mM to load in the glass syringes of the injection pump. Single injections (indicated by the vertical line at 60 s) leading to 125, 250, 500 or 1000 nM final concentrations were made and the respiratory rate (oxygen consumption of cells) was recorded before and after the injection. To increase accuracy, the data points are calculated from the difference between two parallel experiments: one in presence of rotenone (inhibitor of Complex I allowing sulfide oxidation to proceed), and another one in presence of antimycin (inhibitor of Complex III blocking sulfide oxidation). The data points are the mean values of up to 40–50 measurements (10 successive injections of Na2S 125 nM during four to five independent experiments). The dotted line prolongs the slope before sulfide injection for the 125 nM injections. The drop in oxygen concentration caused by sulfide oxidation was determined 1 min after the injection, and was used for the linear regression analysis (insets). The slope relates the stoichiometry (O2/sulfide) for the oxidation process (>95% of the theoretical value of 0.75). There was no correction for Na2S purity/content. While experimental error/difficulties could explain the ordinate at the origin different from zero, this may also suggest that a small part of the sulfide injected escaped to SOU.
Figure 10
Figure 10
Cells can sustain intense sulfide oxidation for minutes. This experiment demonstrates that cells neutralize a continuous sulfide release over extended period of time: Cultured CHO cells (2 × 10⁶ cells·mL−1 in the 2 mL ‘Oroboros O2k’ chamber for other experimental details, see the legend of Figure 9. The curve shows the cellular oxygen consumption rate expressed in pmol/(s·mL) (black dots). In absence of sulfide, this value declines slowly from 90 to 70 with time/decrease in oxygen concentration before the final fast drop when oxygen is exhausted. The 20-min period of sulfide infusion rate at 50 pmol/(s·mL) is indicated with the thick blue line, the dotted lines aim to emphasize on the coincidence between sulfide infusion and increase in cellular oxygen consumption. This increase is calculated and shown (thin blue line), a linear regression was used to estimate the reference value in absence of sulfide. This increase led to the calculation of a value for the stoichiometry close to 0.5, consistent with that of the dioxygenase reaction alone. Accordingly, it is concluded that the respiration based on the use of carbon containing substrates is decreased (thin black line). This experiment illustrates: (i) the importance of respiratory control: the flux of electrons through respiratory chain remains constant because the general controlling factor is ATP turnover. (ii) The fact that SOU oxidation takes precedence over carbon metabolism since the flux of electrons coming from carbon metabolism is diminished from the amount of electrons coming from sulfide oxidation the latter replacing the former. Thus these cells could accommodate for a prolonged time an incoming sulfide flux of a value representing more than 50% of their basal oxygen consumption rate preventing thus sulfide toxicity. In absence of oxidation this infusion would have raised the sulfide oxidation to 60 μM.
Figure 11
Figure 11
Kinetic parameters of sulfide and succinate oxidation in rat liver mitochondria. The experiments shown were made with a O2k apparatus equipped with the TiP injection pumps. A stock solution of 1 M Na2S was prepared each day and diluted at 5 mM to load in the glass syringes of the injection pump. (A) rat liver mitochondria were resuspended (1 mg·mL−1) in a KCl/sucrose medium in presence of rotenone (1 μM), ADP 1.5 mM and Rhodamine123 400 nM. This suspension was loaded in the two chambers of the O2k Oroboros apparatus equipped with the fluorescence detection module. In one chamber was injected the 5 mM solution of Na2S (black traces) and in the other the same volumes of a 50 mM solution of sodium succinate (green traces). The vertical lines indicate the injections with the resulting final concentration shown for sulfide (10 times more for succinate). The bottom traces represent the oxygen consumption rates (left Y axis). The upper trace shows the (Fmax-F)/Fmax value where Fmax is the fluorescent signal of Rhodamine123 in initial non-energized conditions, this value is proportional to the mitochondrial membrane potential. Injection of sulfide results in sharp increase in oxygen consumption that lasts the time to exhaust sulfide. A calculation based on the amount of oxygen consumed and stoichiometry confirms this (not shown). This oxygen consumption is accompanied by transient energization of mitochondria. In contrast, succinate injections caused stepwise increase in oxygen consumption and potential. The gap in the green curves corresponds to a re-oxygenation step necessary to pursue the experiment. After the end of the injections sequence a saturating concentration of succinate (+7.5 mM final) was added to evaluate the maximal rate, which led to anoxia (drop to zero value). (B) values of kinetic constants were calculated by use of the Lineweaver–Burke double reciprocal plot (1/JO2 vs. 1/[Na2S]) to represent the experimental data and the linear fitting of excel to extrapolate the ordinate at the origin (1/Vmax) and interception with the X axis (−1/Km). A logarithmic scale is used individual values (circles) are shown on the left (n = 8 with succinate and 9 with sulfide). The mean values are shown as bars on the right with their values ± SEM. The Vmax for sulfide oxidation could be used to evaluate the flux of incoming sulfide that could be neutralized by the use of the stoichiometric ratio (25/0.75 = 33). Therefore, this experiment suggests that rat liver mitochondria could neutralize a flux of incoming sulfide close to 10% of their maximal phosphorylating respiratory rate. These experiments used optimal conditions: no competition between sulfide and other substrates and high oxygen concentration. Therefore, the in vivo the efficiency of liver to remove sulfide is likely to be lower; indeed, a sulfide turnover that would represent 10% of the metabolic rate of an organ appears unrealistically high. Nevertheless, the capacity of liver mitochondria to neutralize sulfide appears to be significant. The animal experimentation component of the studies was conducted with the approval of the local Animal Care and Use Committee and according to the applicable guidelines of the European Union.
Figure 12
Figure 12
Bell-shaped dose responses to the sulfide donor NaHS in isolated rat liver mitochondria. Rat liver mitochondria were isolated and subjected to bioenergetic analysis using the Extracellular Flux Analysis method as described (Módis et al., 2013b). In separate sets of experiments, mitochondrial electron transport was stimulated by the addition of pyruvate/malate (10 mM/2 mM, respectively, in order to enable the activity of all Complexes; left panel); with succinate (10 mM, in the presence of the Complex I inhibitor rotenone, 2 μM, in order to direct the electron flow exclusively through Complexes II, III and IV only; middle panel) or with the artificial substrates ascorbate/TMPD (10 mM/100 μM, respectively, in the presence of the Complex III inhibitor antimycin at 4 μM, in order to selectively activate Complex IV only; right panel) in the presence of various concentrations of NaHS. Please note that sulfide exerted a biphasic effect on mitochondrial O2 consumption when Complexes I–IV or II–IV were active (stimulation at 0.1–3 μM, followed by inhibition at 30–100 μM), while it only exerted inhibitory effect when Complex IV was active only (at 30–100 μM). Data are shown as mean ± SEM of n = 6 experiments; *P < 0.05 indicates significant enhancement; #P < 0.05 indicates significant inhibition (anova, followed by Tukey's test). The animal experimentation component of the studies was conducted with the approval of the Animal Care and Use Committee (IACUC) of the University of Texas Medical Branch and according to the applicable guidelines of the National Institute of Health.
Figure 13
Figure 13
Biphasic effect of (A): hydrogen sulfide (NaHS) or (B): L-cysteine (L-Cys) on mitochondrial oxygen consumption rate (OCR) in isolated rat liver mitochondria. Rat liver mitochondria were isolated and subjected to bioenergetic analysis using the Extracellular Flux Analysis method as described (Módis et al., 2013b). At lower concentrations, H2S (0.1–1 μM) or L-cysteine (10–1000 μM) elicit a significant increase in mitochondrial activity, as evidenced by the measurement of two parameters, calculated ATP Turnover (state 3) and FCCP-stimulated Maximal Respiratory Capacity (state 3u). Higher concentrations of H2S (3–30 μM) or L-cysteine (3000 μM) suppress mitochondrial activity. The right panels show representative experiments, depicting the effect of H2S (1 μM, top panel) or L-cysteine (L-Cys, bottom panel). All experiments were conducted in the presence of 10 mM succinate. Data represent mean ± SEM of six experiments. *P < 0.05 and **P < 0.01 shows the effect of NaHS or L-cysteine, as compared to vehicle control (anova, followed by Tukey's test). Part A is reproduced with permission from Módis et al. (2013b). The animal experimentation component of the studies was conducted with the approval of the Animal Care and Use Committee (IACUC) of the University of Texas Medical Branch and according to the applicable guidelines of the National Institute of Health.
Figure 14
Figure 14
SQR attenuates the stimulatory effect of cysteine on mitochondrial function. Mitochondria were isolated from cultured Hepa1c1c7 cells and subjected to bioenergetic analysis using the Extracellular Flux Analysis method as described (Módis et al., 2013b). (A, B): Mitochondrial function under basal conditions and in the presence of L-cysteine (10 μM) in cultured murine hepatoma cells during the sequential administration of oligomycin (1 μg·mL−1, to inhibit ATP synthase), FCCP (0.3 μM, to induce mitochondrial uncoupling), 2-deoxyglucose (50 mM, to inhibit glycolysis) and antimycin A (2 μg·mL−1, to inhibit Complex III, for determination of non-mitochondrial cellular respiration). (C, D): Mitochondrial function under basal conditions and in the presence of L-cysteine (10 μM) in cultured murine hepatoma cells after SQR silencing (conducted as described in Módis et al., 2013b). Please note that L-cysteine stimulates mitochondrial function in wild-type cells, while it inhibits mitochondrial function in cells with SQR silencing. Data represent mean ± SEM of n = 15 collected from three experiments performed on three different experimental days. Statistical analysis was performed by anova followed by Bonferroni's post hoc test. *P < 0.05 shows significant difference between groups as indicated.
Figure 15
Figure 15
Effect of the cysteine aminotransferase (CAT) inhibitor aspartate on H2S production and function of isolated rat liver mitochondria. Rat liver mitochondria were isolated and studied as described (Módis et al., 2013b). In part (A) mitochondrial homogenates were subjected to H2S measurements using the methylene blue method in the presence or absence of α-ketoglutarate (0.5 mM), aspartate (2 mM) and L-cysteine (1 mM) and their combinations; in parts (B-D), bioenergetic analysis was performed using the Extracellular Flux Analyzer (Seahorse) in the presence or absence of α-ketoglutarate (0.5 mM), aspartate (2 mM) and L-cysteine (10 μM) and their combinations. Please note that L-cysteine stimulated H2S production and mitochondrial function, while the CAT inhibitor aspartate inhibited these responses. Data represent mean ± SEM of three experiments; *P < 0.05. The animal experimentation component of the studies was conducted with the approval of the Animal Care and Use Committee (IACUC) of the University of Texas Medical Branch and according to the applicable guidelines of the National Institute of Health.
Figure 16
Figure 16
Basal and 3-mercaptopyruvate-induced bioenergetic responses are suppressed in mitochondria prepared from aged mice. Liver mitochondria were isolated from young (2 months old) and aged (18 months old) C57BL/6 mice and subjected to bioenergetic analysis using the Extracellular Flux Analysis method as described (Módis et al., 2013b) in basal conditions or in the presence of 3-mercaptopyruvate (10 μM). Panel A shows the marked suppression of mitochondrial function in aged mice; Panel B shows that the stimulatory effect of 3-MP on mitochondrial function is absent in aged mice. Data represent mean ± SEM of three experiments; *P < 0.05 shows significant difference between the responses of the young and aged groups. The animal experimentation component of the studies was conducted with the approval of the Animal Care and Use Committee (IACUC) of the University of Texas Medical Branch and according to the applicable guidelines of the National Institute of Health.
Figure 17
Figure 17
Mitochondrial localization of H2S-producing enzymes. Rat liver mitochondria were isolated as described (Módis et al., 2013b) and subjected to in vitro partial trypsin digestion by treatment with trypsin for 30 or 60 min at room temperature, followed by addition of an equivalent amount of bovine trypsin inhibitor in order to stop the proteolysis, as described (Szabo et al., 2013). Using this method, mitoplasts (mitochondrial preparation without the outer mitochondrial membrane) can be produced. For Western blotting, rat liver homogenate and rat liver isolated mitochondria were lysed in denaturing loading buffer (20 mM Tris, 2% SDS, 10% glycerol, 6 M urea, 100 mg·mL−1 bromophenol blue, 200 mM β-mercaptoethanol), sonicated and boiled. Lysates (25 μg·well−1) were resolved on 4–12% NuPage Bis–Tris acrylamide gels (Invitrogen, Grand Island, NY, USA) and transferred to PVDF membranes. Membranes were blocked in starting BlockTM T20 (TBS), a commercially available blocking buffer solution (Fischer Scientific, Hampton, NH, USA). Membranes were probed overnight with anti-sulfide quinone reductase-like (SQRDL) antibody (anti-SQR; 1:1500; ProteinTech, Chicago, IL, USA), anti 3-mercaptopyruvate sulfurtransferase antibody (anti-3-MST, 1:1000; Sigma-Aldrich, St. Louis, MO, USA), anti-cystathionine β-synthase (anti-CBS, 1:1000) and anti-cystathionine γ-lyase (anti-CSE, 1:1000) primary antibodies. Moreover, the anti-Tom20 antibody (anti-Tom20, Santa Cruz Biotechnology, Dallas, TX, USA) and anti-Complex IV antibody (anti-CIV, 1:1000, Abcam, Cambridge, MA, USA) were used as different mitochondrial markers, Tom20 localized into the outer mitochondrial membrane, while Complex IV being present exclusively in the inner mitochondrial membrane. On the following day, anti-rabbit-HRP conjugate secondary antibody (1:3000) was applied and enhanced chemiluminescent substrate (ECL, Pierce) was used for detecting the signals. SQR was detected at 50 kDa, 3-MST at 33 kDa, CBS at 60 kDa, CSE at 45 kDa, Complex IV at 17 kDa, and Tom20 was detected at 20 kDa. The Western blot shows that CBS is localized to the mitochondrial outer membrane and largely disappears in the samples that were subjected to limited proteolysis, indicating its primary association to the outer membrane and its low expression in mitoplasts (inner mitochondrial membrane). CSE was not mitochondrially associated. 3-MST and SQR were localized to the mitochondrial inner membrane. As expected from their known respective localizations, trypsin digestion abolished Tom 20 immunoreactivity, but maintained Complex IV levels. A representative Western blot of n = 3 independent experiments is shown. The animal experimentation component of the studies was conducted with the approval of the Animal Care and Use Committee (IACUC) of the University of Texas Medical Branch and according to the applicable guidelines of the National Institute of Health.
Figure 18
Figure 18
Constitutive and inducible sources of H2S production and associated bioenergetic effects in mitochondria. Left panel: H2S in the mitochondria is typically produced by the constitutively expressed 3-mercaptopyruvate sulfurtransferase (3-MST). In vascular smooth muscle cells, cystathionine γ-lyase (CSE) translocates to the mitochondria in response to cellular calcium overload, while in hepatocytes, hypoxia induces the mitochondrial stabilization and accumulation of cystathionine-β-synthase enzyme (CBS). Moreover, in some cells/tissues (e.g. rat liver; HCT116 human colon carcinoma cell line) CBS is associated to the mitochondrial outer membrane and mitochondrial matrix and produces H2S. CBS and CSE, as well as 3-MST produce H2S from their respective substrates; L-cystathionine/L-cysteine for CSE; L-homocysteine/L-cysteine for CBS and 3-mercaptopyruvate for 3-MST (produced from L-cysteine/α-ketoglutarate by the enzyme CAT). Right panel: mitochondrial electron transport is primarily fuelled by the oxidation of carbon-based substrates, which leads to the reduction of the NAD or FAD coenzymes. The reduced forms of these coenzymes (NADH + H, FADH2) deliver electrons to coenzyme Q of the mitochondrial respiratory chain. NADH + H is oxidized by mitochondrial Complex I. FADH2 coenzymes yield electrons through the function of Complex II (succinate dehydrogenase). Both Complexes (I and II) donate electrons via coenzyme Q of the mitochondrial electron transport chain. H2S, produced in the vicinity of the mitochondria, working in close cooperation with the sulfide-oxidizing unit (SOU), stimulates and balances mitochondrial electron transport. The SOU is constituted of the mitochondrial membrane-bound sulfide quinone reductase (SQR) and of two other enzymes the sulfur dioxygenase (ETHE1, also called dioxygenase ethylmalonic encephalopathy) and the thiosulfate sulfur transferase (TST, also known as one isoenzyme of the rhodanese), ensuring the final oxidation of the two disulfides (-SSH) bound to SQR into oxidized cysteine linked by a disulfide bond. The sulfur dioxygenase in the mitochondrial matrix oxidizes persulfides to sulfite (SO32), consuming molecular oxygen and water. Sulfite, then, is further oxidized to sulfate (SO42−) by sulfite oxidase (SOX). The thiosulfate sulfur transferase (TST) produces thiosulfate (S2O32) by transferring the second persulfide from the SQR to sulfite. SQR is responsible for the oxidation of H2S in the mitochondria. While from two H2S molecules, two disulfides (-SSH) bounds are created on the SQR, two electrons derived from two H2S molecules also enter the mitochondrial electron transport chain, promoting mitochondrial ATP generation. Higher concentrations of H2S can also inhibit Complex IV, thereby inhibiting mitochondrial respiration.
Figure 19
Figure 19
CBS silencing attenuates the bioenergetics in the model organism Caenorhabditis elegans. The C. elegans wild-type N2 Bristol strain was obtained from the C. elegans Genetics Center, University of Minnesota, Minneapolis, MN, USA. Nematode culturing, synchronization and RNAi feeding were performed according to standard techniques (Vozdek et al., 2012). Egg isolation was done using the bleaching method. The resulting embryos were placed in S-complete medium without OP50 bacteria, and allowed to hatch overnight at 20°C with constant rotation. The L1 larvae were counted and supplemented with strain OP50 bacteria with pL4440-CBS or pL4440-scrambled RNAi feeding vector containing Ampicillin resistance marker to resume the life cycle. RNAi induction of bacteria was induced by IPTG. L1 larvae were transferred to a flask in a concentration of 80–100 worms·mL−1 in S-complete. To sterilize the animals, FUDR (5-fluoro-2'-deoxyuridine, Sigma-Aldrich) stock solution was added to each well 50 h after hatching. Five days after reaching adult stage, worms were washed with water and collected for subsequent Western blot analysis. For Western blot analysis followed by immuno-detection of CBS-1 a rabbit polyclonal antibody against recombinant CBS-1 was used. The general technique of the functional analysis of the metabolic activity of the worms was conducted using a 24-well Seahorse Extracellular Flux Analyzer as described (Houtkooper et al., 2013) with 50 worms per well under basal conditions and upon the addition of the uncoupling agent FCCP (10 μM). CBS silencing attenuated CBS-1 protein expression, and suppressed basal and FCCP-stimulated oxygen consumption. Data are shown as mean ± SEM of n = 20 determinations collected from three experimental days. Oxygen consumption was normalized to protein content. Statistical analysis was performed by anova followed by Bonferroni's post hoc test. #P < 0.05 and ##P < 0.01 show lower oxygen consumption in the CBS-1 silenced group, when compared to the respective sham-silenced controls.
Figure 20
Figure 20
H2S production by the intestinal microbiota: its clearance and utilization by the gastrointestinal tract. Intestinal bacteria produce H2S from various substrates of alimentary origin (for the overview of the exact biochemical pathways involved, see Carbonero et al., ,b2012b). Colonic epithelial cells take up and degrade, as well as utilize sulfide. A small portion of sulfide enters the circulation, and is further neutralized by the liver. The potential contribution of intestinal microbiota as a source of systemic/tissue sulfide remains to be defined by further studies.

References

    1. Attene-Ramos MS, Nava GM, Muellner MG, Wagner ED, Plewa MJ, Gaskins HR. DNA damage and toxicogenomic analyses of hydrogen sulfide in human intestinal epithelial FHs 74 Int cells. Environ Mol Mutagen. 2010;51:304–314. - PubMed
    1. Beauchamp RO, Jr, Bus JS, Popp JA, Boreiko CJ, Andjelkovich DA. A critical review of the literature on hydrogen sulfide toxicity. Crit Rev Toxicol. 1984;13:25–97. - PubMed
    1. Beltowski J. Hypoxia in the renal medulla: implications for hydrogen sulfide signaling. J Pharmacol Exp Ther. 2010;334:358–363. - PubMed
    1. Blachier F, Davila AM, Mimoun S, Benetti PH, Atanasiu C, Andriamihaja M, et al. Luminal sulfide and large intestine mucosa: friend or foe? Amino Acids. 2010;39:335–347. - PubMed
    1. Blackstone E, Morrison M, Roth MB. H2S induces a suspended animation-like state in mice. Science. 2005;308:518. - PubMed

Publication types