Review
. 2013 Sep;16(3):168-76.
doi: 10.1053/j.tvir.2013.02.012.

Image fusion during vascular and nonvascular image-guided procedures

Affiliations
Review

Image fusion during vascular and nonvascular image-guided procedures

Nadine Abi-Jaoudeh et al. Tech Vasc Interv Radiol. 2013 Sep.

Abstract

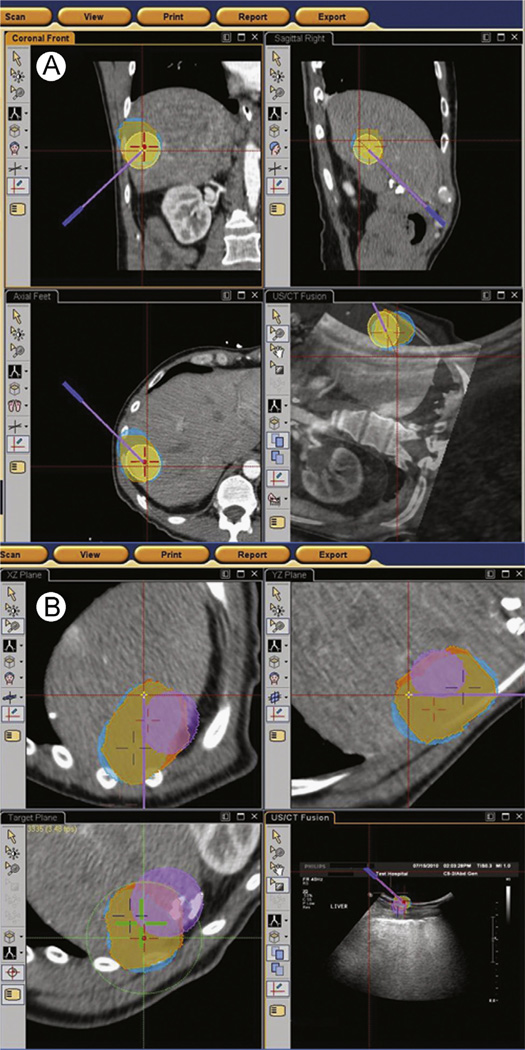
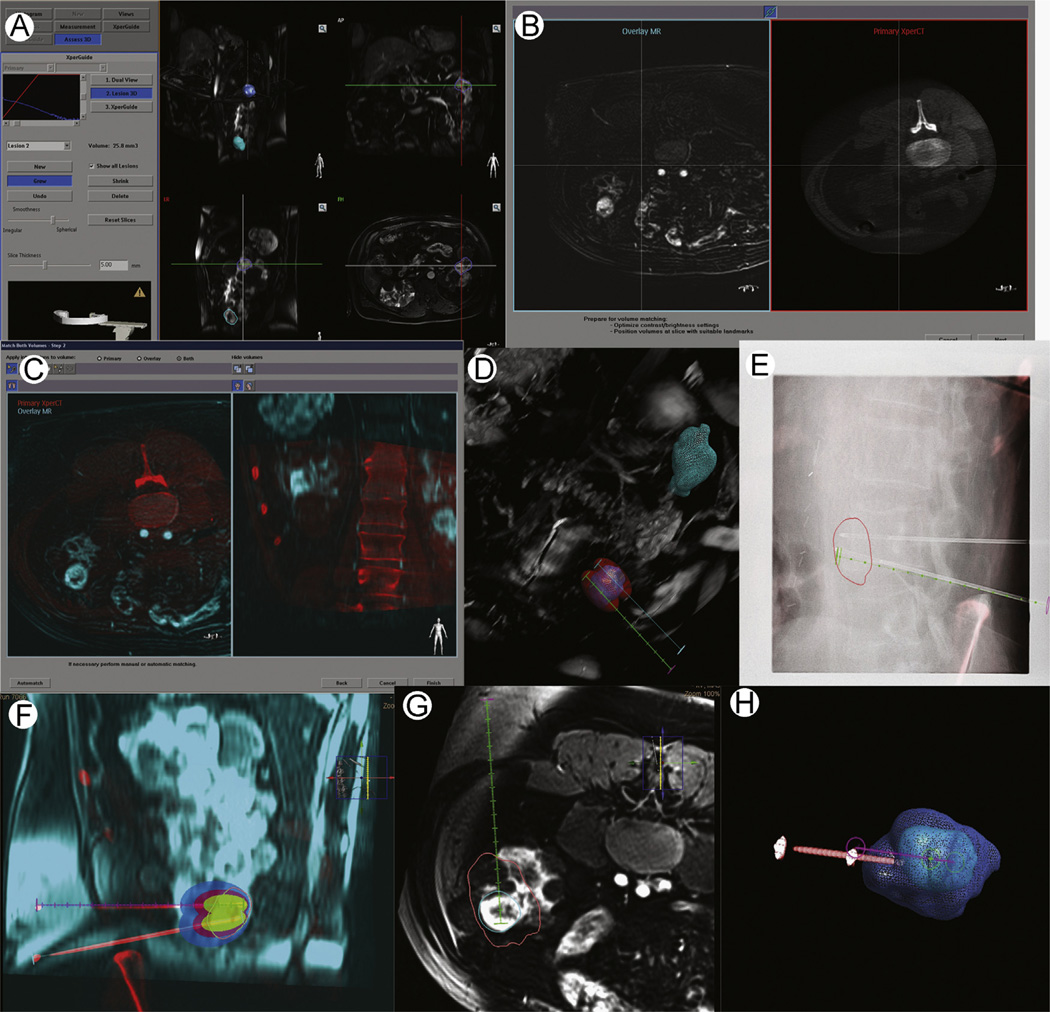
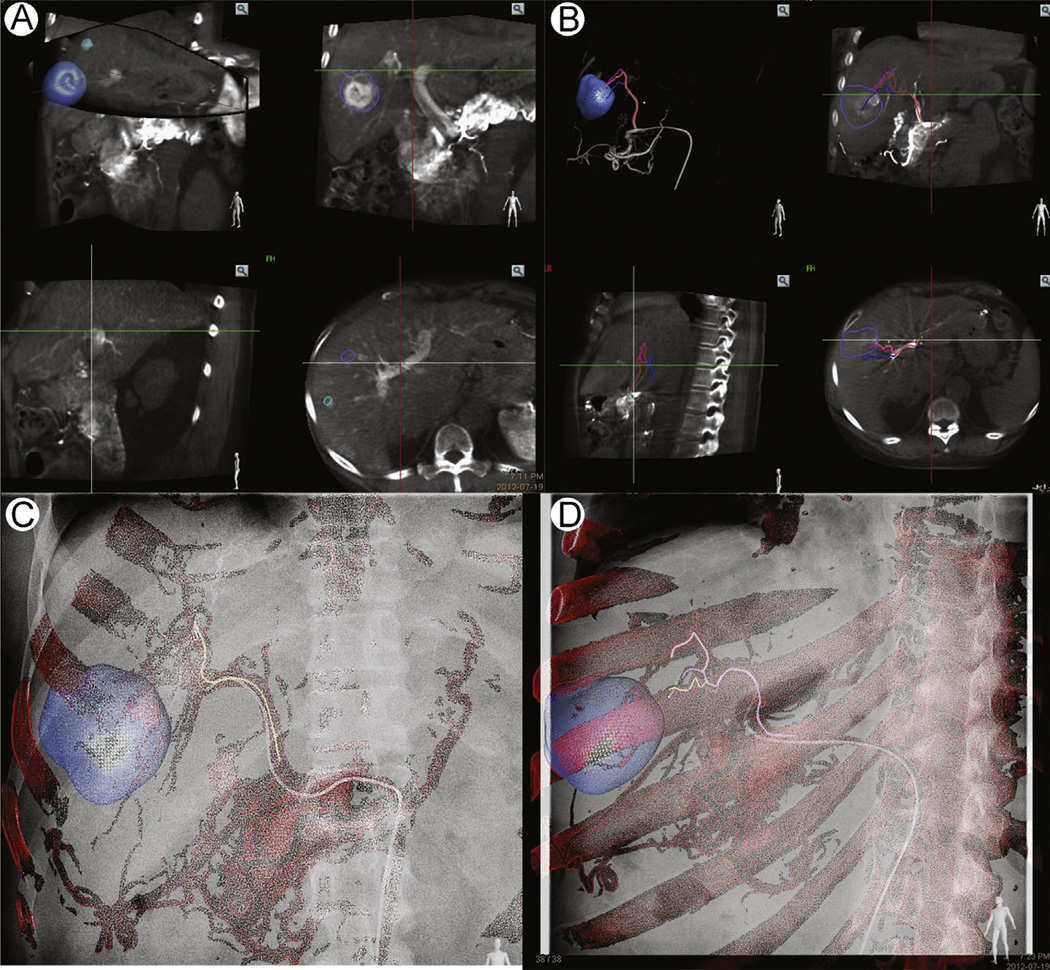
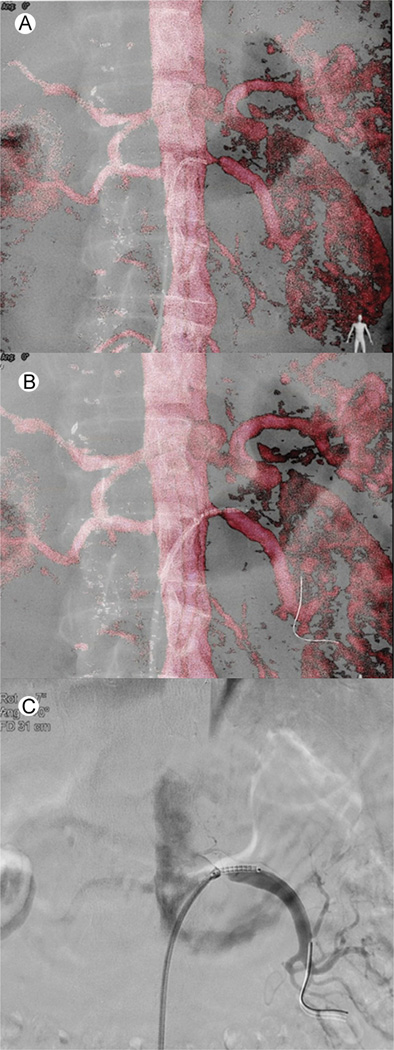
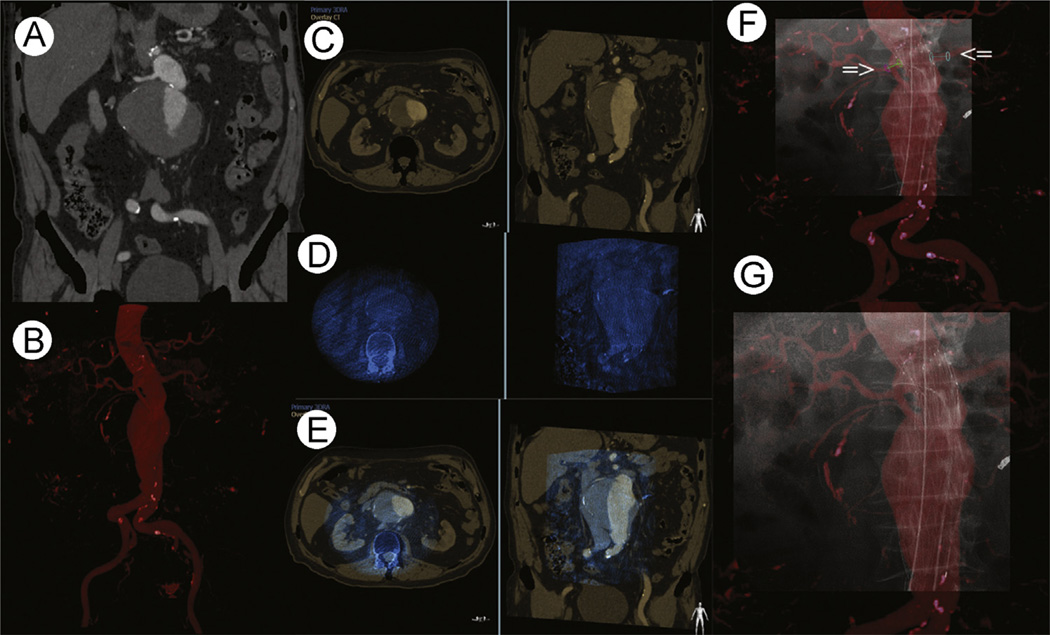
Image fusion may be useful in any procedure where previous imaging such as positron emission tomography, magnetic resonance imaging, or contrast-enhanced computed tomography (CT) defines information that is referenced to the procedural imaging, to the needle or catheter, or to an ultrasound transducer. Fusion of prior and intraoperative imaging provides real-time feedback on tumor location or margin, metabolic activity, device location, or vessel location. Multimodality image fusion in interventional radiology was initially introduced for biopsies and ablations, especially for lesions only seen on arterial phase CT, magnetic resonance imaging, or positron emission tomography/CT but has more recently been applied to other vascular and nonvascular procedures. Two different types of platforms are commonly used for image fusion and navigation: (1) electromagnetic tracking and (2) cone-beam CT. Both technologies would be reviewed as well as their strengths and weaknesses, indications, when to use one vs the other, tips and guidance to streamline use, and early evidence defining clinical benefits of these rapidly evolving, commercially available and emerging techniques.

Keywords: Fusion; cone-beam CT navigation; electromagnetic tracking; navigation.


Figures

Figure 1
Figure 1
Ablation planning case: (A) depicts coronal, axial, and sagittal views of a contrast-enhanced CT. The tumor and safety margin have been segmented (orange circles). The ablations zones required for complete coverage are also seen (blue circles). The target position for the ablation probe is depicted as the red cross. The virtual probe is seen as the purple line. As the operator advances the tracked probe, the “virtual” probe position adjusts in the software. (B) After the first ablation is complete, the ablation planning software updates the treated areas (as per manufacturer specifications) shown as the purple circle. If applicable, it also adjusts the position of subsequent probes seen as the red and purple crosses. The imaging can also be fused with ultrasound for real-time imaging guidance as seen on the left bottom screen. (Color version of figure is available online.)
Figure 2
Figure 2
Workflow of image fusion for CBCT. Patient with von Hippel-Lindau disease, multiple lesions and a new enhancing renal lesion are seen on MRI (A) the previous MRI is imported into the workstation and the lesion is segmented. (B-C) the MR is registered to the procedural CBCT. (D) The number of probes and their trajectory is planned by the operator, taking advantages of the information available on CBCT and preprocedural MRI. In this case, 2 lesions are seen (blue and green circles). The 3D reconstruction of the CBCT is displayed. Two probes were needed to ensure complete coverage of the inferior lesion. The data can be examined in the axial, coronal, and sagittal planes as well. (E) The operator advances the ablation following the virtual planned path displayed on live fluoroscopy. Both needles are planned on the same CBCT; however during navigation 1 virtual path is displayed at a time. The segmented tumor is seen. (F) Once the target is reached, a CBCT image is obtained to confirm needle positioning. Registration with preprocedural imaging is automatically updated. (G-H) After cryoablation, the iceball is segmented. The post-CBCT is registered to the pre-CBCTand the ablation is examined to ensure complete coverage. (Color version of figure is available online.)
Figure 3
Figure 3
CBCT image workflow for transarterial chemoembolization; dual-phase CBCT, with arterial and venous phase acquired from the C-arm spinning back and forth or twice around the patient. (A) The lesions are segmented from the venous phase. (B) The arterial supply to the segmented lesions is extracted from the arterial CBCT. This process may be semiautomated or manual. A virtual path is mapped from the catheter position to the desired vessels. (C and D) The vascular map and virtual path are overlaid on the live fluoroscopy. The image may be adjusted to account for magnification, or table or C-arm movement. (Color version of figure is available online.)
Figure 4
Figure 4
Renal artery stenting CBCT image fusion workflow. (A) Catheterization of the left renal artery using the volume-rendering MRA overlay. The tip of the catheter is in the ostium of the stenosed renal artery. (B) Placement of the stent under VR MRA overlay to cover the entire lesion. No contrast was used till this part of the procedure. (C) To confirm stent position in relation to stenosis prior to final deployment, 3 cc of contrast was injected. (Color version of figure is available online.)
Figure 5
Figure 5
Endovascular stent graft deployment with navigation. (A) Coronal view of contrast-enhanced CT depicting a large infrarenal aortic aneurysm with a short neck. (B) Multiplanar volume rendering of the contrast-enhanced CT. (C) Axial and coronal views of the contrast-enhanced CT demonstrating the infrarenal aortic aneurysm. (D) Axial and coronal views of the nonenhanced cone-beam CT demonstrating the infrarenal aortic aneurysm. These images match C. (E) Axial and coronal views of the fused cone-beam CT and contrast-enhanced CT overlaid on top of each other. The CBCT has a bluish tint. (F) Once registration and fusion are complete, the contrast-enhanced CT can be displayed on top of live fluoroscopy image, as shown. Markers (arrows) are placed over the renal arteries. The image shows the stent partially deployed. (G) Fluoroscopy image with CT-MPR overlay during stent deployment. MPR, multiplanar reconstruction. (Color version of figure is available online.)

References

    1. Oliveira FP, Tavares JM. Medical image registration: A review. Comput Methods Biomech Biomed Engin. 2012 - PubMed
    1. Zanzonico PB, Nehmeh SA. Introduction to clinical and laboratory (small-animal) image registration and fusion. Conference proceedings : Annual International Conference of the IEEE Engineering in Medicine and Biology Society IEEE Engineering in Medicine and Biology Society Conference. 2006;1:1580–1583. - PubMed
    1. Markelj P, Tomazevic D, Likar B, et al. A review of 3D/2D registration methods for image-guided interventions. Med Image Anal. 2012;16:642–661. - PubMed
    1. Markelj P, Tomazevic D, Likar B, et al. A review of 3D/2D registration methods for image-guided interventions. Med Image Anal. 2012;16:642–661. - PubMed
    1. Giesel FL, Mehndiratta A, Locklin J, et al. Image fusion using CT, MRI and PET for treatment planning, navigation and follow up in percutaneous RFA. Exp Oncol. 2009;31:106–114. - PMC - PubMed

Publication types

MeSH terms