. 2013 Aug 29;154(5):971-982.
doi: 10.1016/j.cell.2013.07.037.

Identification of long-lived proteins reveals exceptional stability of essential cellular structures

Affiliations

Identification of long-lived proteins reveals exceptional stability of essential cellular structures

Brandon H Toyama et al. Cell. .

Abstract

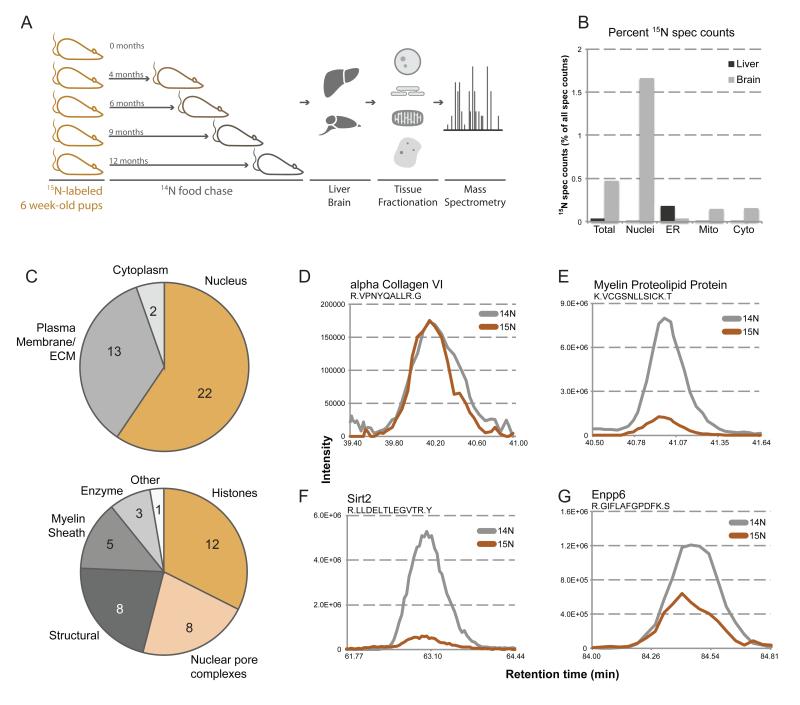
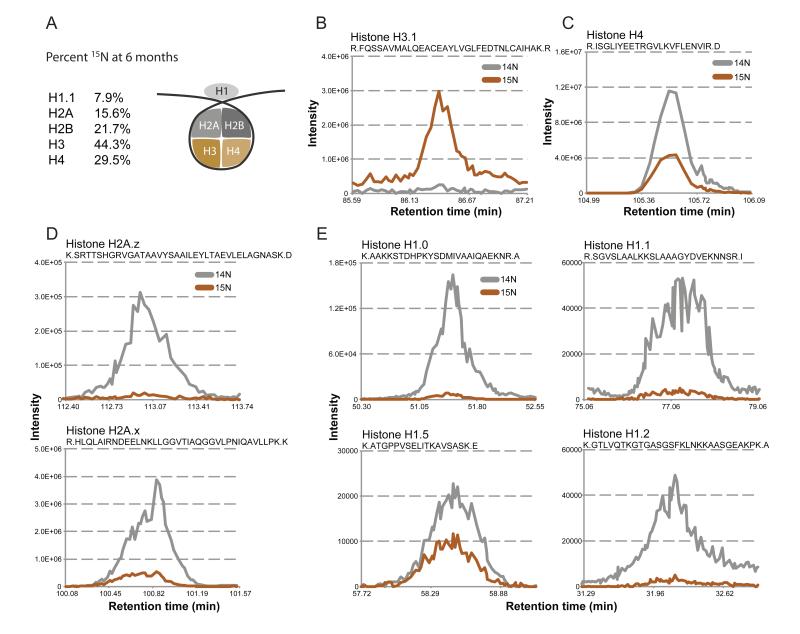
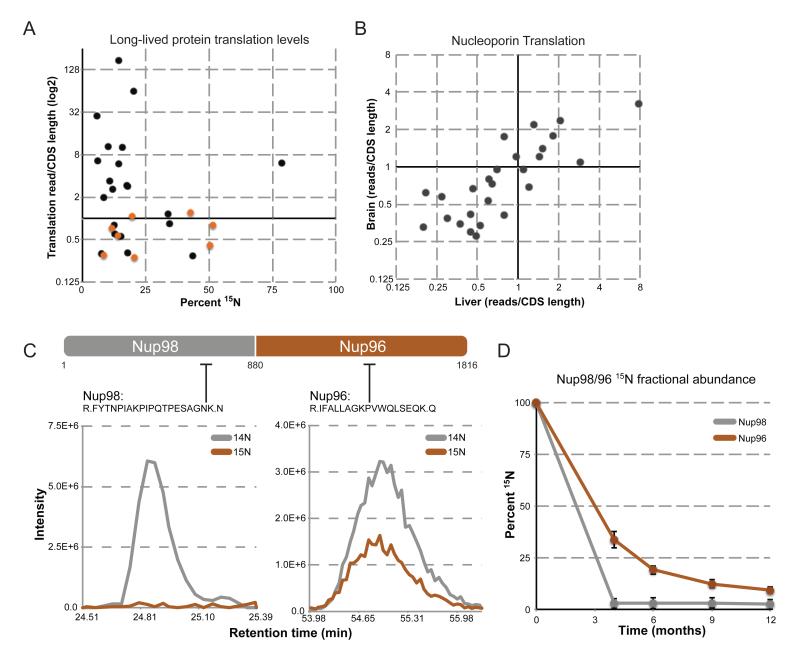
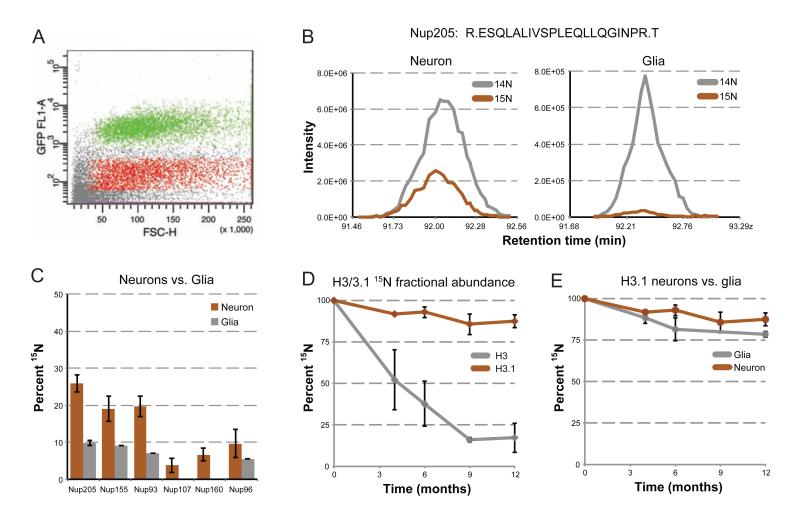
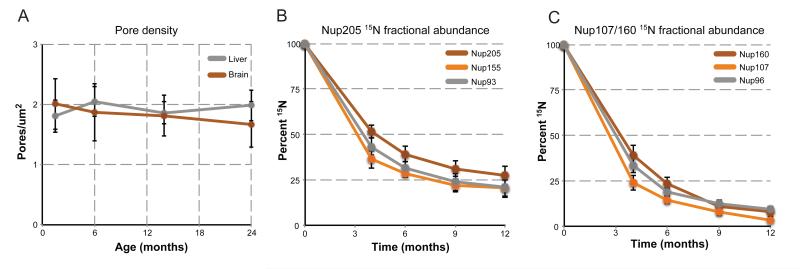
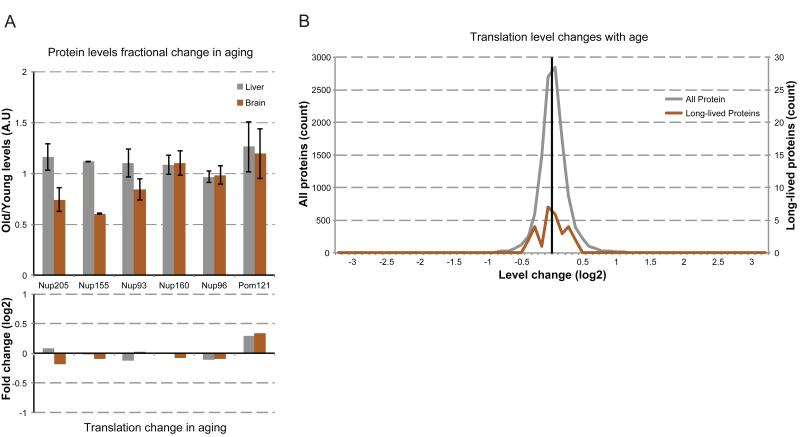
Intracellular proteins with long lifespans have recently been linked to age-dependent defects, ranging from decreased fertility to the functional decline of neurons. Why long-lived proteins exist in metabolically active cellular environments and how they are maintained over time remains poorly understood. Here, we provide a system-wide identification of proteins with exceptional lifespans in the rat brain. These proteins are inefficiently replenished despite being translated robustly throughout adulthood. Using nucleoporins as a paradigm for long-term protein persistence, we found that nuclear pore complexes (NPCs) are maintained over a cell's life through slow but finite exchange of even its most stable subcomplexes. This maintenance is limited, however, as some nucleoporin levels decrease during aging, providing a rationale for the previously observed age-dependent deterioration of NPC function. Our identification of a long-lived proteome reveals cellular components that are at increased risk for damage accumulation, linking long-term protein persistence to the cellular aging process. PAPERCLIP:


Figures

Figure 1
Figure 1
Discovery of new members of the long-lived proteome. (A) Pulse-chase labeling of whole rats. Depicted is a schematic of the pulse-chase labeling procedure. Litters of rats were fully 15N-labeled through feeding a 15N diet starting from a previous generation. Fully labeled rats were then switched to a normal 14N diet (chase) at 6 weeks post-natal, and sacrificed a 0, 4, 6, 9, and 12 months post-chase. Tissues were harvested, fractionated, and analyzed by MS (B) Tissue localization of long-lived proteins. 15N spectral counts were calculated and plotted as a percentage of total spectral counts in each fraction of liver (grey) and brain (black) tissues from an animal 6-months post-chase. (C) Cellular localization and processes of long-lived proteins. Identified long-lived proteins were sorted by subcellular localization (upper) and cellular process (lower), and plotted as a pie chart, inset numbers representing the number of proteins per localization. (D-G) MS1 traces of representative peptides. Aligned elution profile MS1 traces are plotted for representative peptides for alpha collagen VI (D), myelin proteolipid protein (E), Sirt2 (F), and Enpp6 (G), with 15N signal in orange and 14N signal in grey. See also Figure S1-3.
Figure 2
Figure 2
Long-lived histones at 6 months. (A) Long-lived histone octamer. Schematic of the histone octamer, and 15N fractional abundance at 6-months post-chase for indicated histones. For H2A and H2B, the 15N fractional abundance was calculated from peptides that map to representative core (not variant) histones, and H3 fractional abundance determined from peptides common to all three major H3 variants (H3.1, H3.2, H3.3). (B-E) Example histone MS1 traces. MS1 elution profiles are plotted as described earlier from 6-months post-chase brain tissue for, (B) the single unique peptide for histone H3.1, (C) histone H4, (D) histone H2A variants H2A.z and H2A.x, and (E) H1 variants H1.0, H1.1, H1.5, and H1.2.
Figure 3
Figure 3
Protein translation does not correlate with protein lifespan. (A) Protein translation levels of long-lived proteins. Translation levels (reads/CDS length) of long-lived proteins are plotted (log2) against their corresponding 15N fractional abundance at 6 months post-chase. Translation levels of long-lived nucleoporins are plotted in orange. (B) Translation levels of NPC proteins in liver and brain tissue. Translation levels of all NPC proteins were determined in liver (horizontal axis) and brain (vertical axis) tissue, and plotted against each other (log2). (C) Translation and stability of Nup98/96. Top: Schematic of the Nup98/96 translated peptide, as well as the cleavage site (a.a. 880) that produces the separate Nup98 and Nup96 proteins. Lower: Elution profile MS1 traces of the indicated peptides from the Nup98 and Nup96 region, plotted as describe for Figure 1 D-G. (D) Stability of Nup98/96 over 12 months. Average 15N fractional abundance for Nup98 (grey) and Nup96 (orange) was determined from multiple peptides for each indicated time point and plotted over time.
Figure 4
Figure 4
15N fractional abundance decay rates in neuronal versus glial nuclei. (A) FACS sorting of brain nuclei. Brain nuclei were purified and labeled with a fluorescent marker for neuronal nuclei (NeuN), and sorted for NeuN positive and negative populations. Plotted is a scatter plot of representative sorted events, with positive (green) and negative (red) sorted populations highlighted. (B) 15N fractional abundance decay of Nup205 in neurons versus glia. Elution profile MS1 traces, as described earlier, are plotted for the same peptide from Nup205, originating from neuron-enriched (left) and glial-enriched (right) sorted nuclei from a 1-year post-chase rat. (C) 15N fractional abundance decay of Nups in neurons versus glia. Average 15N fractional abundance for each indicated Nup was determined from multiple peptides from the same neuron-enriched (orange) and glial-enriched (grey) nuclei described in B. (D) Histone H3.1 stability. 15N fractional abundance was determined for the single unique H3.1 peptide at 0, 4, 6, 9, and 12 months post-chase from multiple animals (orange), and plotted against peptides from the same time points which were common to all histone H3 variants (grey). (E) Histone H3.1 in neurons versus glia. 15N fractional abundance was determined for the single unique H3.1 peptide at 0, 4, 6, 9, and 12 months post-chase from neuron-enriched (orange) and glial-enriched (grey) sorted nuclei, and plotted over time. Note: we did not observe any peptides for glia 9-months post-chase. All error bars are plotted as a standard deviation. See also Figure S4.
Figure 5
Figure 5
Long-term maintenance of the NPC. (A) NPC pore density through aging. Brain and liver nuclei were purified from 6 week, 6, 13, and 24 month-old rats and fixed. NPCs were stained and visualized by super-resolution microscopy, and individual pores counted for each nucleus (n > 30). Plotted are the average pore densities (pores per nuclei surface area [μM]) for brain (orange) and liver (grey) nuclei across the entire time span. See also Figure S5. (B) 15N fractional abundance decay of the Nup205 complex. 15N fractional abundance was determined from multiple peptides for the indicated members of the Nup205 complex, from neuronal-enriched nuclei from all time points of the pulse-chase and plotted over time. (C) 15N fractional abundance decay of the Nup107/160 complex. 15N fractional abundance was determined from multiple peptides for the indicated members of the Nup107/160 complex, from neuronal-enriched nuclei from all time points of the pulse-chase and plotted over time. All error bars represent standard deviations.
Figure 6
Figure 6
NPC composition changes with age. (A) NPC levels with age. Upper: NPCs were purified from brain (orange) and liver (grey) nuclei from rats at 6 (young) and 24 (old) months of age. Indicated Nup levels were determined by western blot, normalized to Nup107 levels. Plotted are the old levels normalized to the young levels. Lower: Translation levels of the indicated Nups from 6-month-old rat brains were compared to translation levels of 24-month-old rat brains, and plotted as old/young translation levels (log2 scale). (B) Changes in translation levels (old rate/young rate, log2 scale) were binned by log2 fold change (0.1 unit bins) and plotted as a histogram for all proteins (grey, >11,000 proteins, left vertical scale) and the identified long-lived proteins (orange, right vertical scale). See also Figure S5.

References

    1. Ahmad K, Henikoff S. The histone variant H3.3 marks active chromatin by replication-independent nucleosome assembly. Molecular cell. 2002;9:1191–1200. - PubMed
    1. Arber N, Zajicek G, Ariel I. The streaming liver. II. Hepatocyte life history. Liver. 1988;8:80–87. - PubMed
    1. Bassnett S. Lens organelle degradation. Experimental eye research. 2002;74:1–6. - PubMed
    1. Bassnett S, Shi Y, Vrensen GF. Biological glass: structural determinants of eye lens transparency. Philosophical transactions of the Royal Society of London Series B. Biological sciences. 2011;366:1250–1264. - PMC - PubMed
    1. Belle A, Tanay A, Bitincka L, Shamir R, O’Shea EK. Quantification of protein half-lives in the budding yeast proteome. Proceedings of the National Academy of Sciences of the United States of America. 2006;103:13004–13009. - PMC - PubMed

Publication types