Clinical Trial
. 2013 Dec;163(6):1585-1591.e9.
doi: 10.1016/j.jpeds.2013.07.017. Epub 2013 Aug 29.

A comparison of two probiotic strains of bifidobacteria in premature infants

Affiliations
Clinical Trial

A comparison of two probiotic strains of bifidobacteria in premature infants

Mark A Underwood et al. J Pediatr. 2013 Dec.

Abstract

Objective: To determine the impact of 2 probiotic bifidobacteria on the fecal microbiota of premature infants fed either human milk or formula.

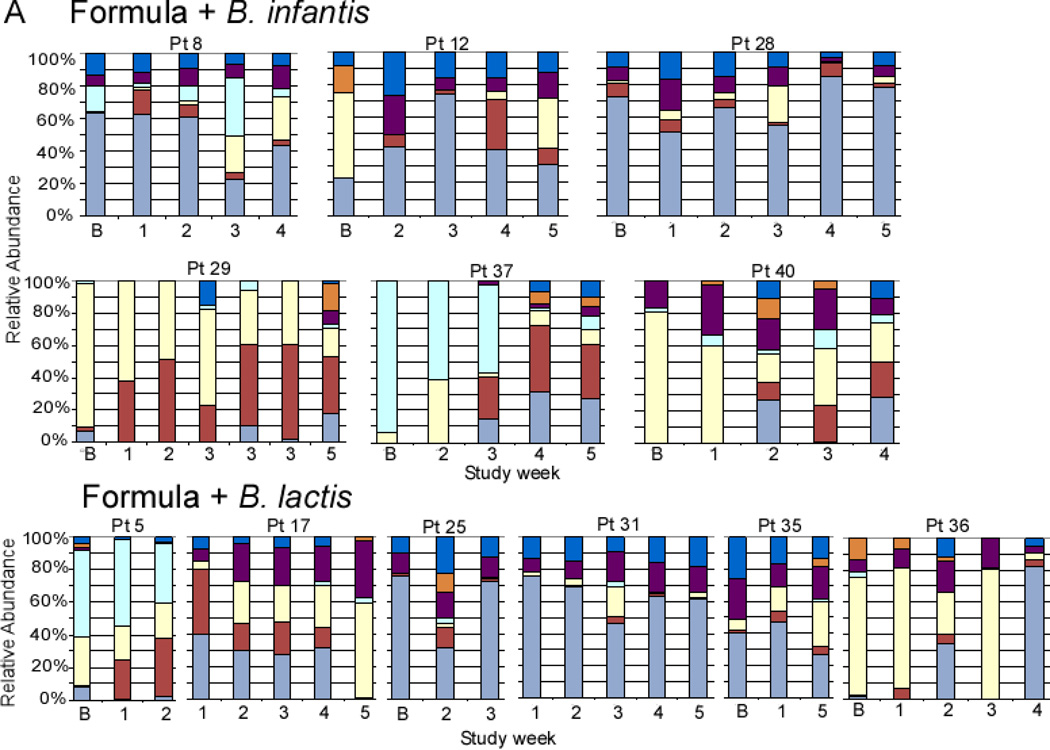
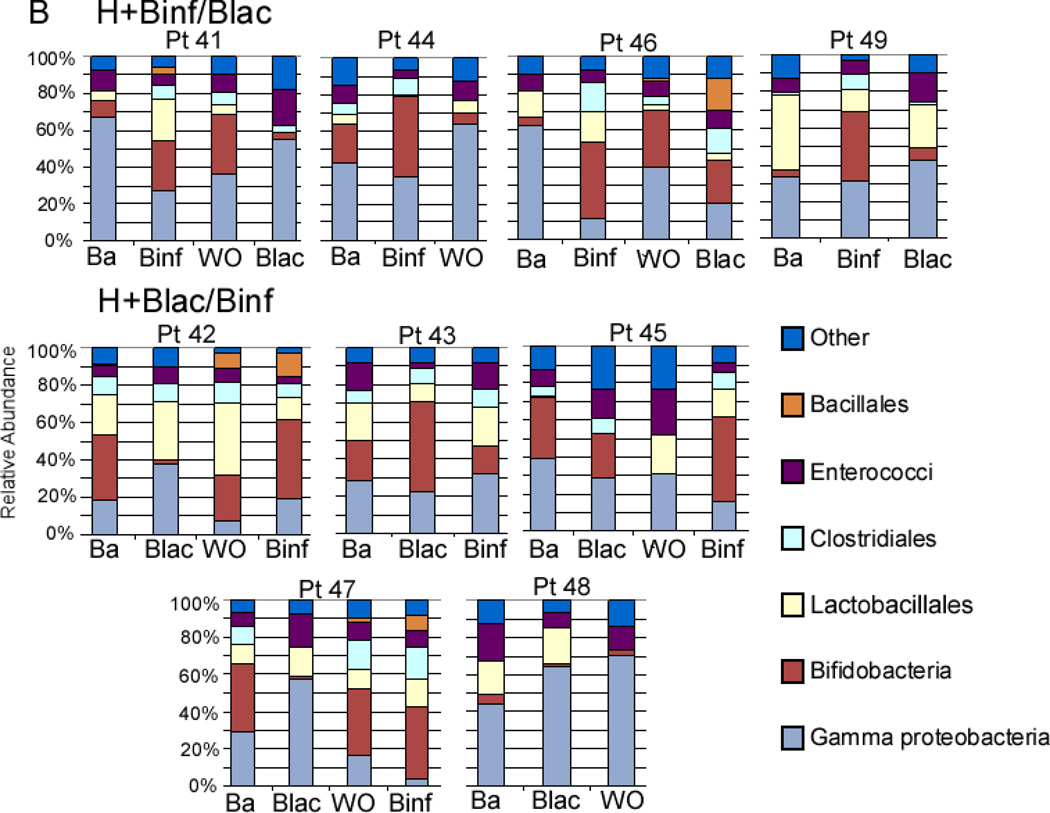
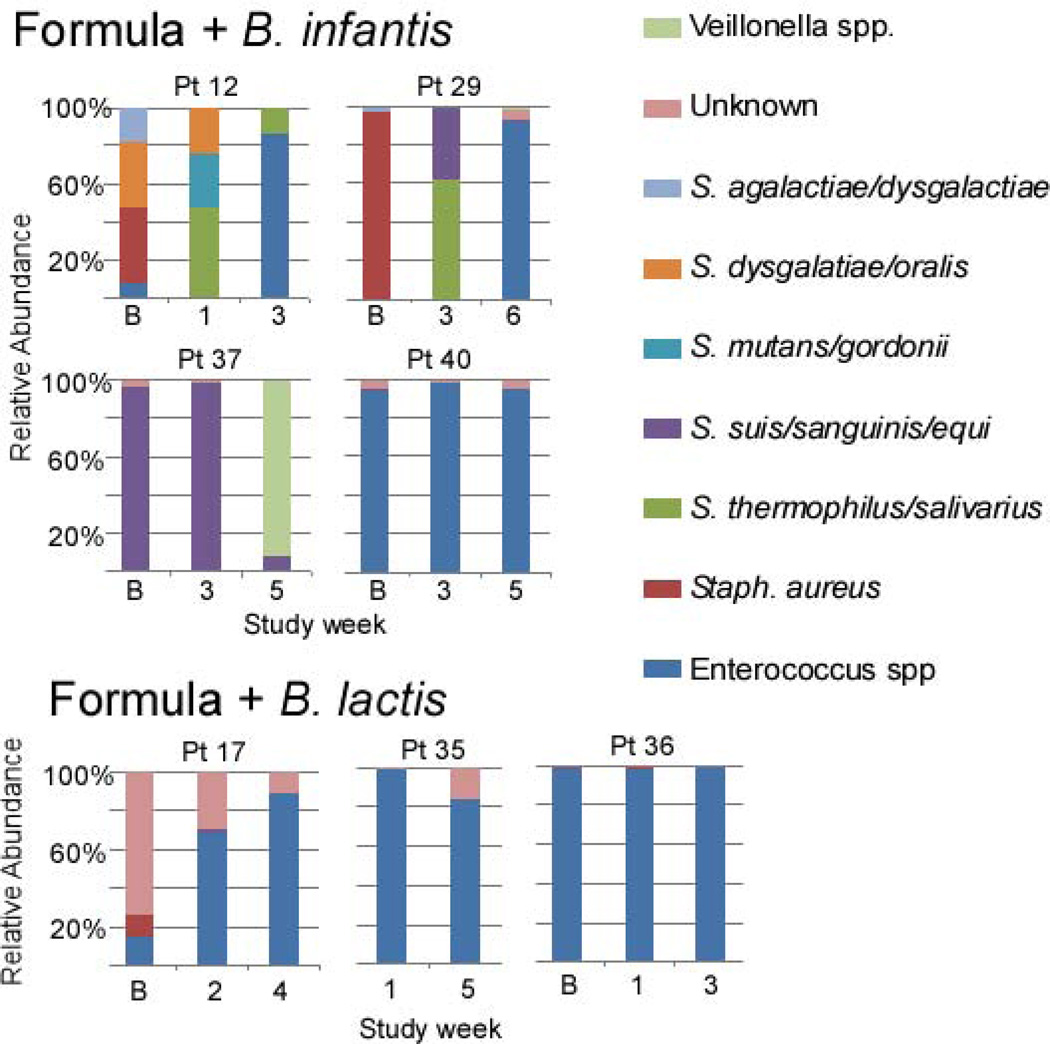
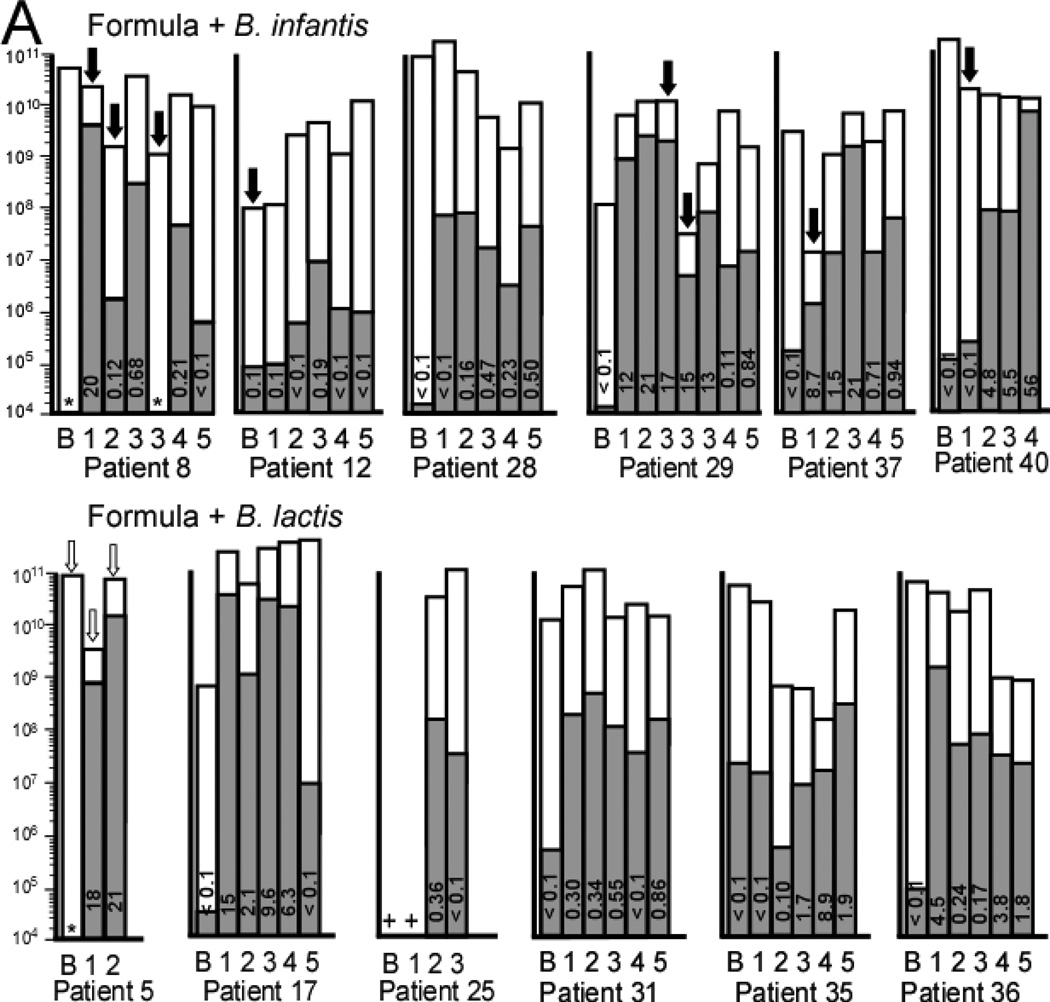
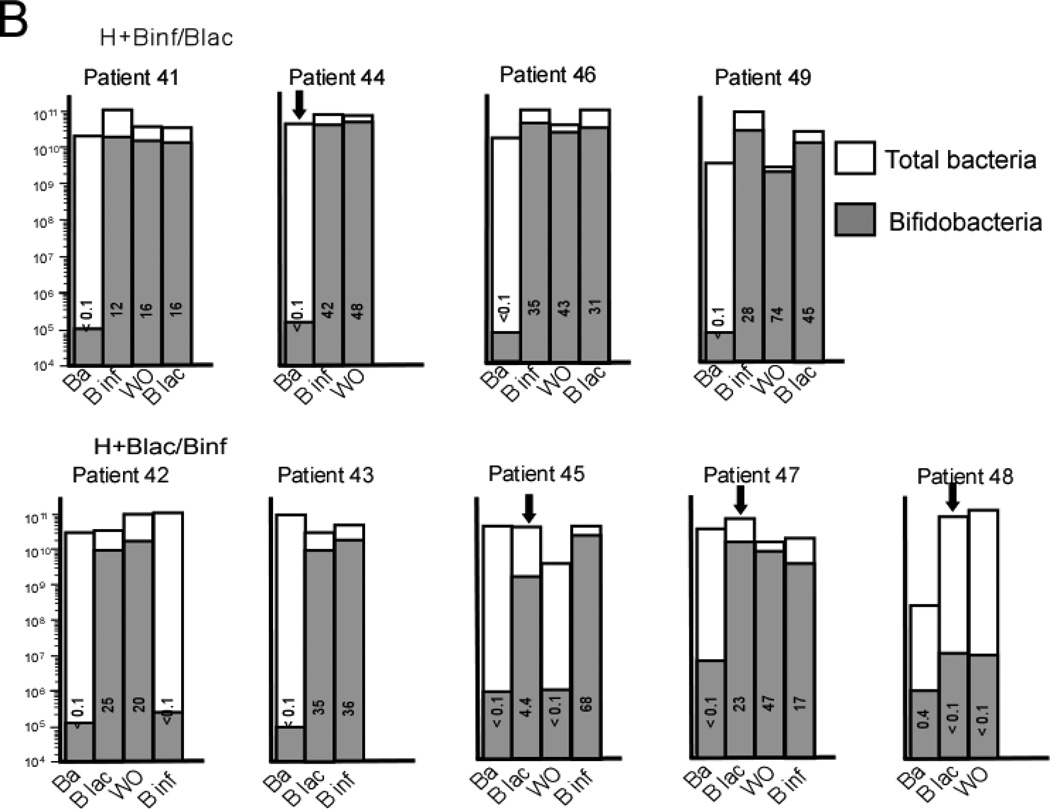
Study design: In the first of two phase 1 clinical trials, 12 premature infants receiving formula feedings were assigned randomly to receive either Bifidobacterium longum ssp infantis or Bifidobacterium animalis ssp lactis in increasing doses during a 5-week period. In the second, 9 premature infants receiving their mother's milk received each of the two bifidobacteria for 2 weeks separated by a 1-week washout period. Serial stool specimens from each infant were analyzed by terminal restriction fragment-length polymorphism and quantitative polymerase chain reaction for bacterial composition.

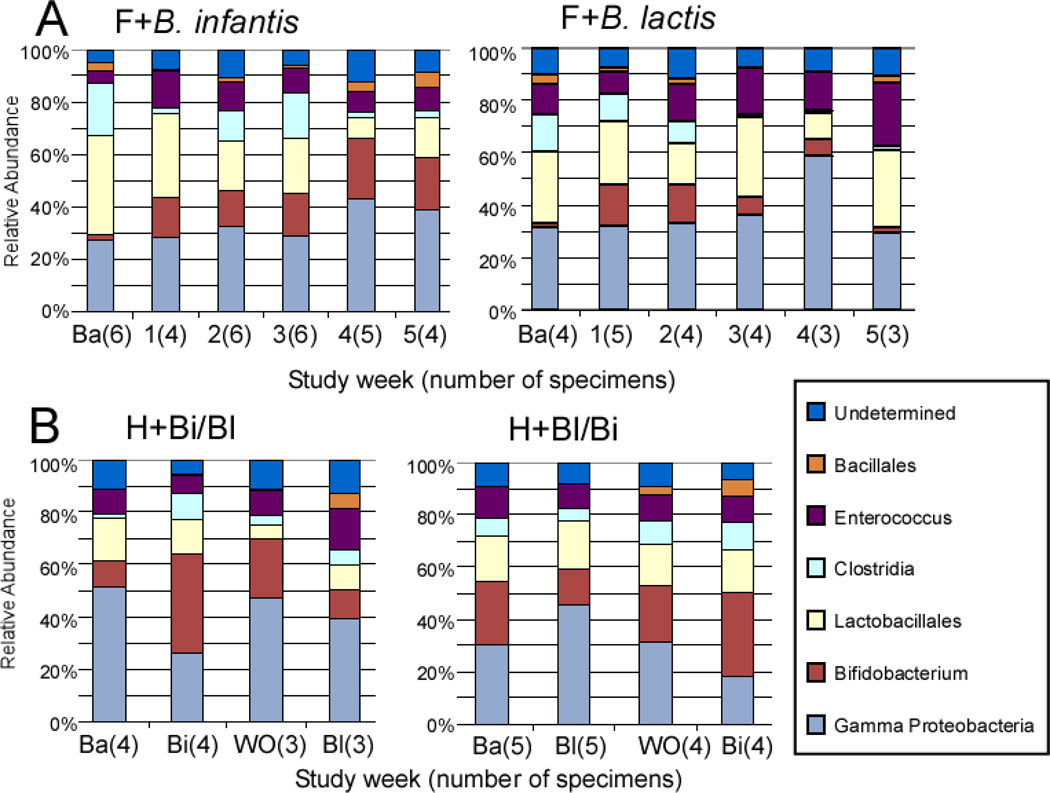
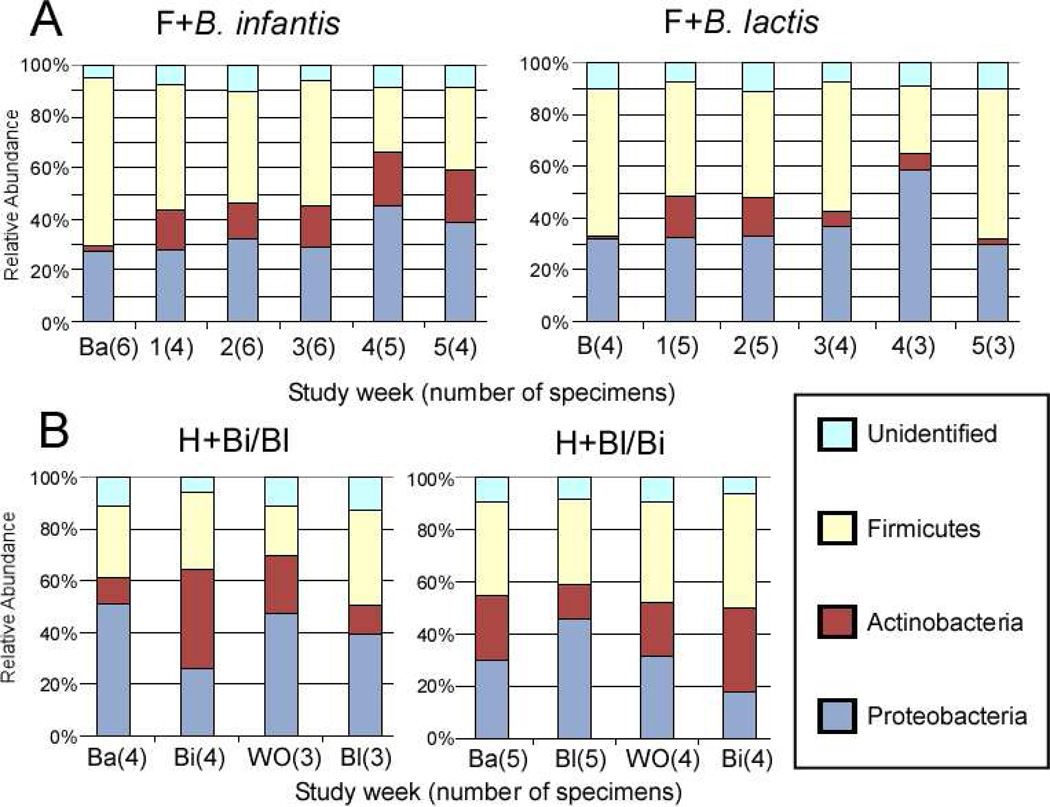
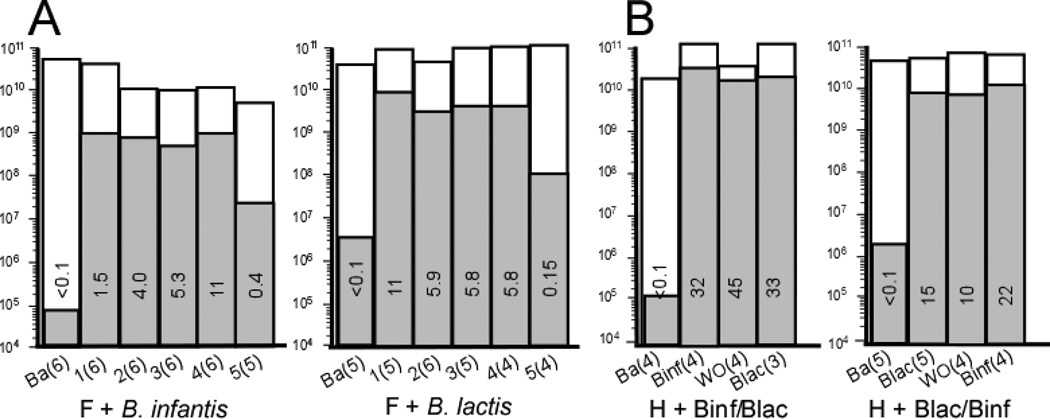
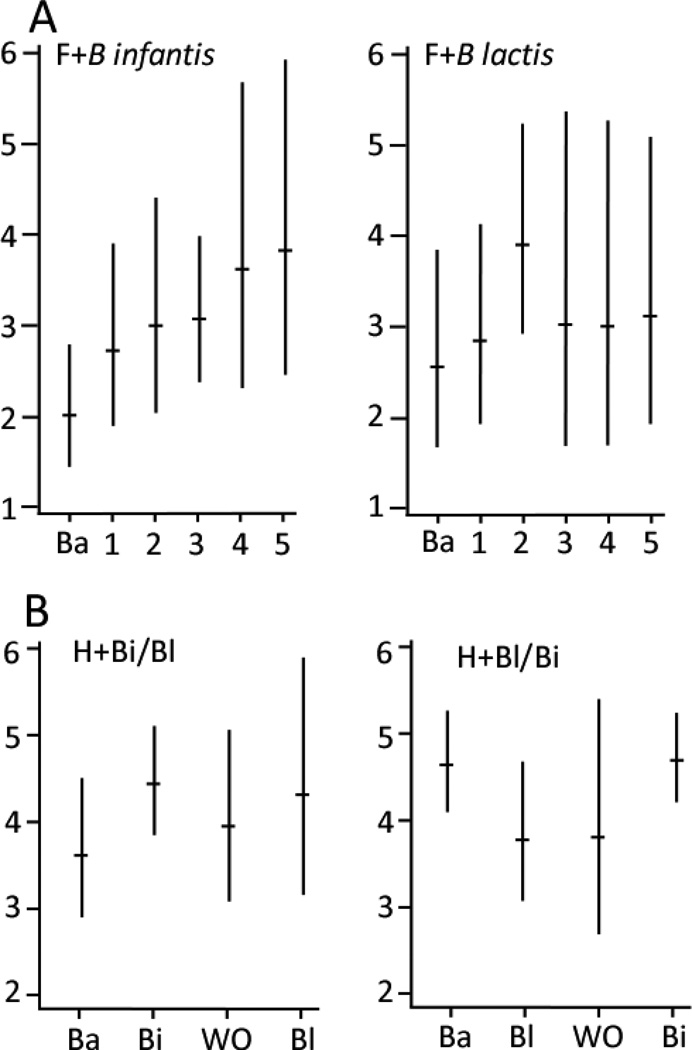
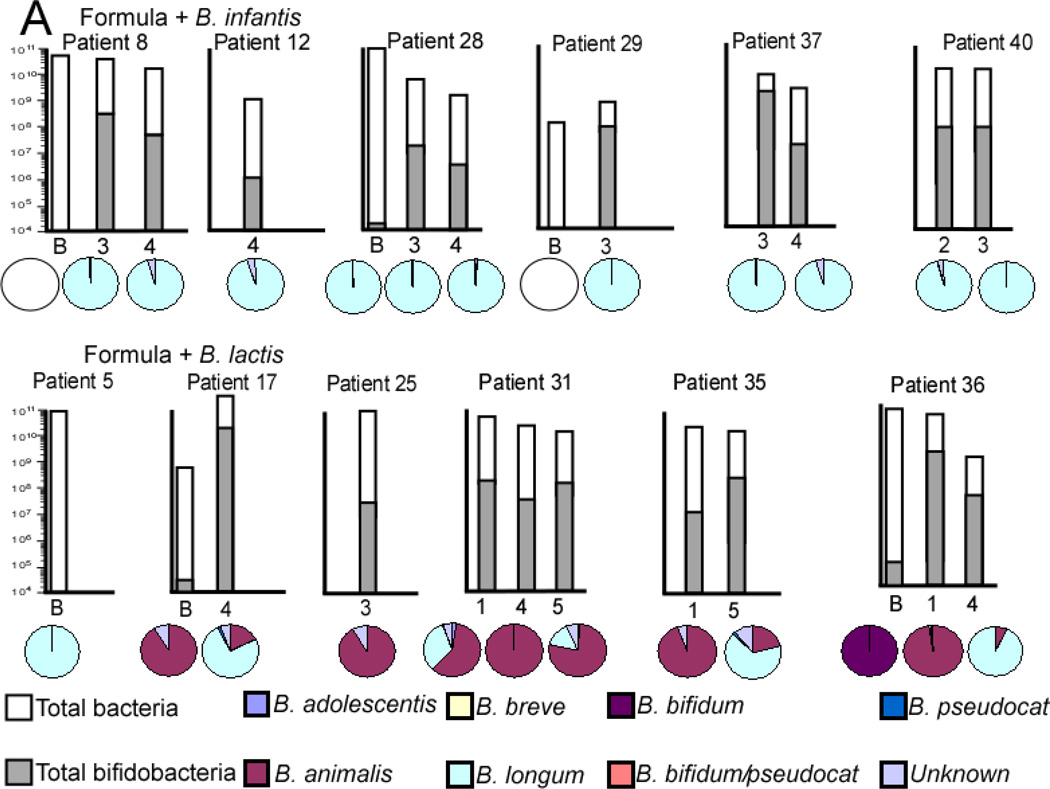
Results: Among the formula-fed infants, there was a greater increase in fecal bifidobacteria among infants receiving B infantis (Binf) than those receiving B lactis (Blac). This difference was most marked at a dose of 1.4 × 10(9) colony-forming units twice daily (P < .05). Bacterial diversity improved over dose/time in those infants receiving Binf. Among the human milk-fed infants, greater increases in fecal bifidobacteria and decreases in γ-Proteobacteria followed the administration of Binf than Blac. The B longum group (which includes Binf but not Blac) was the dominant bifidobacteria among the human milk-fed infants, regardless of the probiotic administered.

Conclusions: Binf was more effective at colonizing the fecal microbiota than Blac in both formula-fed and human milk-fed premature infants. The combination of human milk plus Binf resulted in the greatest fecal levels of bifidobacteria.

Trial registration: ClinicalTrials.gov NCT00810160.

Keywords: B infantis; B lactis; Bac-TRFLP; Bacilli-specific terminal restriction fragment-length polymorphism; Bif-TRFLP; Bifidobacteria-specific terminal restriction fragment-length polymorphism; Binf; Blac; Colony-forming units; F+Binf; F+Blac; Formula plus Binf; Formula plus Blac; H+Binf; H+Blac; HMO; Human milk oligosaccharides; Human milk plus Binf; Human milk plus Blac; NEC; Necrotizing enterocolitis; PBS; PCoA; Phosphate-buffered saline; Principal coordinate analysis; Quantitative polymerase chain reaction; Ribosomal RNA; TRFLP; Terminal restriction fragment-length polymorphism; UC Davis; University of California, Davis; WO; Washout; cfu; qPCR; rRNA.


Conflict of interest statement

The authors declare no conflicts of interest.

Figures

Figure 1
Figure 1
Growth of B. infantis and B. lactis in culture media containing human milk oligosaccharides as the sole carbon source.
Figure 2
Figure 2
Principal Coordinate Analysis (PCoA) of 16S-TRFLP data. Principal components were calculated based on Bray-Curtis distance of MspI digest TRFLP profiles of all infants at all timepoints. A presents all specimens from the dose escalation trial (orange = baseline specimens, red = F+Binf, blue = F+Blac). B presents all specimens from the crossover trial (orange = baseline, purple = washout, green = H+Binf, blue = H+Blac).
Figure 3
Figure 3
Universal Bacteria 16S-TRFLP analysis. Each color represents the mean percentage of the noted bacterial genus or order present in the specimen for each group at each time point. Ba = baseline specimen, F = formula, H = human milk, Bi = B. infantis, Bl = B lactis.
Figure 4
Figure 4
Bacterial 16-TRFLP analysis. Each color represents the mean percentage of the noted bacterial phylum present in the specimen for each group at each time point.
Figure 5
Figure 5
Individual 16S-TRFLP analysis for each patient and each time point. A Infants receiving formula in the dose escalation trial. B Infants receiving human milk in the cross-over trial. Ba = baseline
Figure 5
Figure 5
Individual 16S-TRFLP analysis for each patient and each time point. A Infants receiving formula in the dose escalation trial. B Infants receiving human milk in the cross-over trial. Ba = baseline
Figure 6
Figure 6
Bacilli-TRFLP. Each color represents the percentage of Bacilli (Bacillales and Lactobacillales) of the noted bacterial species or genus in the specimen.
Figure 7
Figure 7
qPCR analysis of mean total bacteria (white bars) and mean Bifidobacteria (gray bars) for each group at each time point. The number in each bar represents the percentage of total bacteria that are Bifidobacteria. The Y axis for total bacteria is a logarithmic scale and represents copies 16S rRNA gene per g stool. A Infants receiving formula in the dose escalation trial. B Infants receiving human milk in the cross-over trial. Ba = baseline, WO = washout.
Figure 8
Figure 8
Individual qPCR analysis of mean total bacteria (white bars) and mean Bifidobacteria (gray bars) for each patient at each time point. A Infants receiving formula in the dose escalation trial. B Infants receiving human milk in the cross-over trial. The number in each bar represents the percentage of Bifidobacteria in that specimen. * = no Bifidobacteria detected (limit of detection 1 × 10⁴ copies 16S rRNA gene per g stool). + = DNA not available for this specimen. Ba = baseline specimen. Note that the Y axis is a logarithmic scale and represents copies 16S rRNA gene per g stool. Black arrows represent antibiotics given in the week prior to this specimen. White arrows represent TMP-SMX given in the week prior to this specimen.
Figure 8
Figure 8
Individual qPCR analysis of mean total bacteria (white bars) and mean Bifidobacteria (gray bars) for each patient at each time point. A Infants receiving formula in the dose escalation trial. B Infants receiving human milk in the cross-over trial. The number in each bar represents the percentage of Bifidobacteria in that specimen. * = no Bifidobacteria detected (limit of detection 1 × 10⁴ copies 16S rRNA gene per g stool). + = DNA not available for this specimen. Ba = baseline specimen. Note that the Y axis is a logarithmic scale and represents copies 16S rRNA gene per g stool. Black arrows represent antibiotics given in the week prior to this specimen. White arrows represent TMP-SMX given in the week prior to this specimen.
Figure 9
Figure 9
Geometric mean Shannon diversity scores with 95% confidence intervals. A formula-fed infants (dose escalation). B human milk-fed infants (cross-over).
Figure 10
Figure 10
qPCR analysis of total bacteria (white bars) and Bifidobacteria (gray bars) and Bifidobacteria-specific TRFLP (pie charts) for selected specimens in each group. The Y axis for total bacteria is a logarithmic scale and represents copies 16S rRNA gene per g stool. The pie charts represent percentages of total Bifidobacteria not percentages of total bacteria.

References

    1. Wang Q, Dong J, Zhu Y. Probiotic supplement reduces risk of necrotizing enterocolitis and mortality in preterm very low-birth-weight infants: an updated meta-analysis of 20 randomized, controlled trials. J Pediatr Surg. 2012;47:241–248. - PubMed
    1. Deshpande G, Rao S, Patole S, Bulsara M. Updated meta-analysis of probiotics for preventing necrotizing enterocolitis in preterm neonates. Pediatrics. 2010;125:921–930. - PubMed
    1. Neu J. Routine probiotics for premature infants: let's be careful! J Pediatr. 2011;158:672–674. - PMC - PubMed
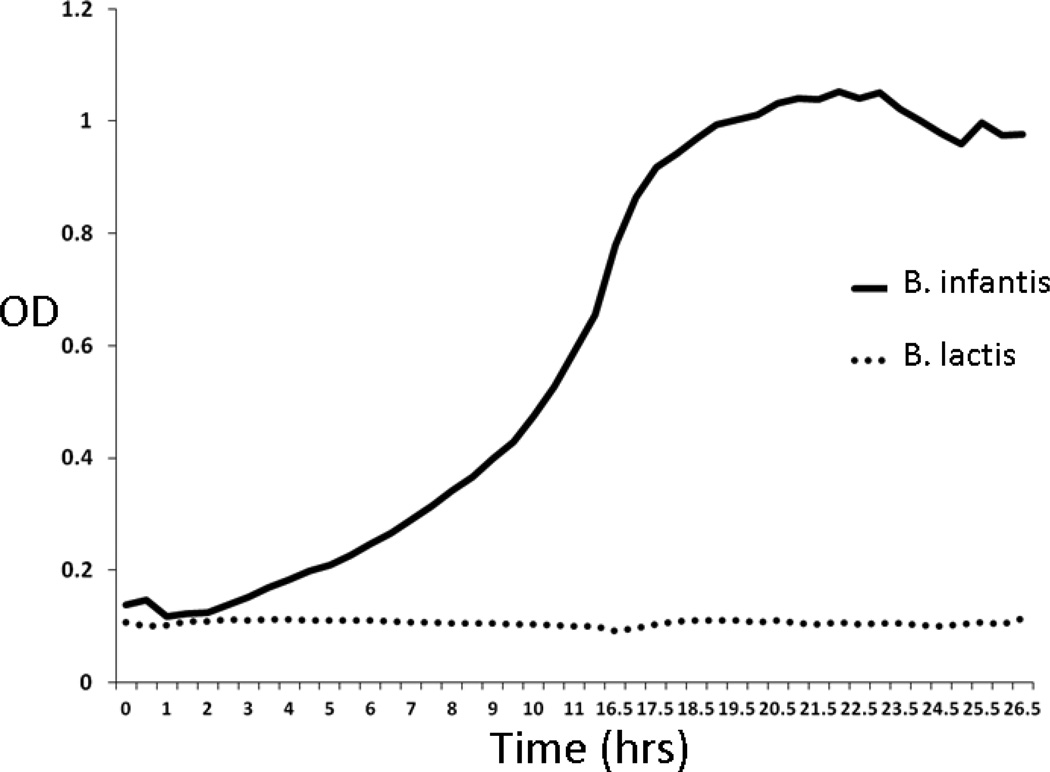
    1. Ward RE, Ninonuevo M, Mills DA, Lebrilla CB, German JB. In vitro fermentability of human milk oligosaccharides by several strains of bifidobacteria. Mol Nutr Food Res. 2007;51:1398–1405. - PubMed
    1. Sela DA, Mills DA. Nursing our microbiota: molecular linkages between bifidobacteria and milk oligosaccharides. Trends Microbiol. 2010;18:298–307. - PMC - PubMed

Publication types

Associated data