. 2013 Sep 5;93(3):482-95.
doi: 10.1016/j.ajhg.2013.07.016. Epub 2013 Aug 29.

Mutations in FBXL4, encoding a mitochondrial protein, cause early-onset mitochondrial encephalomyopathy

Affiliations

Mutations in FBXL4, encoding a mitochondrial protein, cause early-onset mitochondrial encephalomyopathy

Xiaowu Gai et al. Am J Hum Genet. .

Abstract

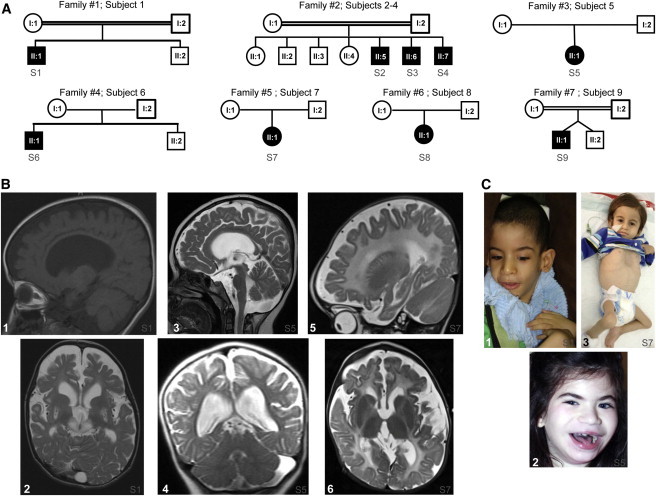
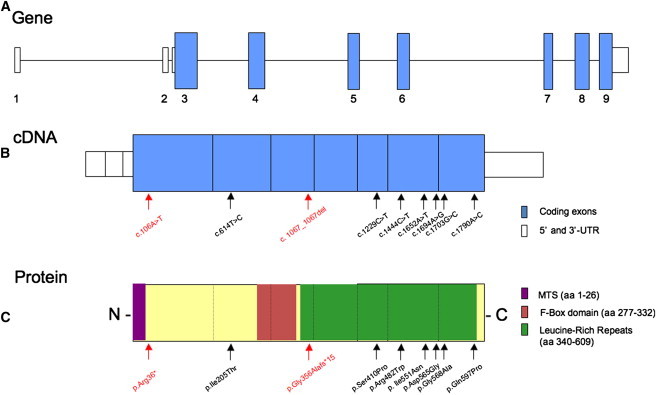
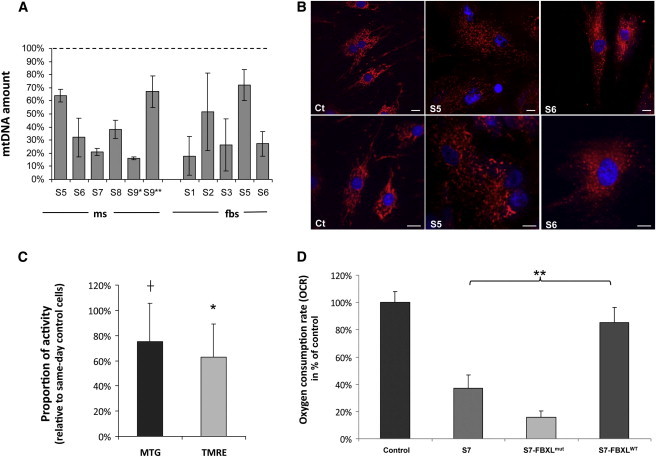
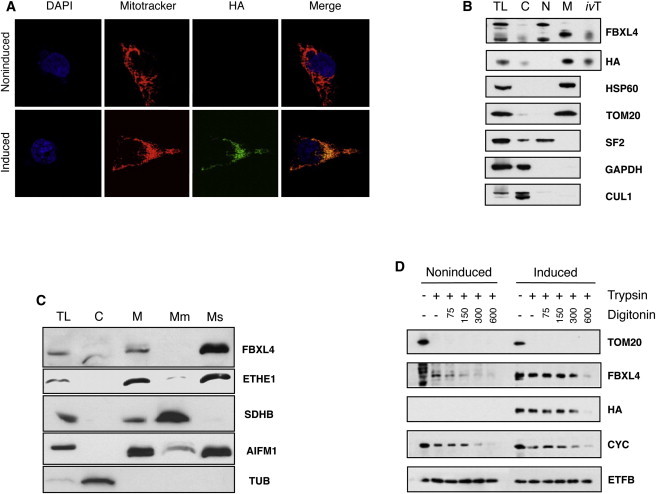
Whole-exome sequencing and autozygosity mapping studies, independently performed in subjects with defective combined mitochondrial OXPHOS-enzyme deficiencies, identified a total of nine disease-segregating FBXL4 mutations in seven unrelated mitochondrial disease families, composed of six singletons and three siblings. All subjects manifested early-onset lactic acidemia, hypotonia, and developmental delay caused by severe encephalomyopathy consistently associated with progressive cerebral atrophy and variable involvement of the white matter, deep gray nuclei, and brainstem structures. A wide range of other multisystem features were variably seen, including dysmorphism, skeletal abnormalities, poor growth, gastrointestinal dysmotility, renal tubular acidosis, seizures, and episodic metabolic failure. Mitochondrial respiratory chain deficiency was present in muscle or fibroblasts of all tested individuals, together with markedly reduced oxygen consumption rate and hyperfragmentation of the mitochondrial network in cultured cells. In muscle and fibroblasts from several subjects, substantially decreased mtDNA content was observed. FBXL4 is a member of the F-box family of proteins, some of which are involved in phosphorylation-dependent ubiquitination and/or G protein receptor coupling. We also demonstrate that FBXL4 is targeted to mitochondria and localizes in the intermembrane space, where it participates in an approximately 400 kDa protein complex. These data strongly support a role for FBXL4 in controlling bioenergetic homeostasis and mtDNA maintenance. FBXL4 mutations are a recurrent cause of mitochondrial encephalomyopathy onset in early infancy.


Figures

Figure 1
Figure 1
Pedigrees and Clinical Features (A) Pedigrees. Black symbols designate affected subjects. Families and subjects are numbered according to the main text. (B) Brain MRI. Panels 1 and 2 are subject 1 at 2 years of age; panels 3 and 4 are subject 5 at 4 years of age; and panels 5 and 6 are subject 7 at 9 months of age. Panels 1 and 2: T1-weighted sagittal interhemispheric (#1) and T2-weighted transverse (#2) sequences, displaying a thin corpus callosum, severe supratentorial brain atrophy, abnormal signals in the white matter, especially in subcortical areas, and bilateral lesions of the putamina and subthalamic region. The putaminal lesions contain scattered areas of reduced intensity possibly corresponding to calcifications. The cisternal spaces are increased. A subaracnoid cyst is visible in the occipital region. Panels 3 and 4: T2-weighted sagittal (#3) and coronal (#4) sequences displaying severe supratentorial brain atrophy and leukodystrophic changes; the infratentorial structures, including the cerebellum, are relatively spared, in spite of marked enlargement of the cisternal spaces. Panels 5 and 6: T2-weighted sagittal (#5) and transverse (#6) sequences displaying severe supratentorial brain atrophy and leukodystrophic changes; the basal nuclei, thalami, and infratentorial structures, including the cerebellum, are relatively spared. (C) Panel 1: Subject 1 at 4 years of age; panel 2: subject 5 at 8 years of age; panel 3: subject 7 at 14 months of age. Note the facial dysmorphisms in #1 (dolichocephaly, protruded ears, narrow elongated face, and everted lower lip) and #2 (including smooth and hypotonic facies, mild synophrys, luxurious eyelashes, thick and arched eyebrows, bilateral epicanthal folds, thick lower lip with finely demarcated upper vermilion border) and pectus excavatum in #3.
Figure 2
Figure 2
FBXL4 Gene, cDNA, and Protein (A) Genomic structure of FBXL4 with coding (blue) and noncoding (white) exons. (B) FBXL4 cDNA (NM_012160.3) with nucleotide changes identified in this study. (C) FBXL4 protein with amino acid changes identified in this study. Functional domains of FBXL4 are in color. Abbreviation: MTS, mitochondrial targeting sequence. Red arrows indicate mutations that cause the premature truncation of FBXL4, therefore predicting the loss of its function.
Figure 3
Figure 3
Molecular, Biochemical, and Morphological Studies in FBXL4 Mutant Muscle and Fibroblasts (A) Quantification of mtDNA amount in muscle (ms) and fibroblasts (fbs) from available subjects (S). For subject 9, DNAs from two different muscle biopsies were analyzed (S9, 13 days of age; S9∗∗, 13 months of age). The bars represent the percentage of mtDNA normalized to nuclear DNA in FBXL4 mutant subjects, compared to the mean value of controls (dotted line, 100%; range of control values: 60%–160% for muscle, 70%–145% for fibroblasts). Data are represented as mean ± SD. (B) Representative images of mitochondrial morphology in fibroblasts, showing filamentous (control, Ct) or fragmented (subjects 5 and 6) mitochondrial networks. Cells were stained with MitoTracker-Red CMX-Ros (Invitrogen) and Hoechst, a blue nuclear dye, 50 nM for 30 min. Scale bars represent 10 μm. (C) Reductions in mitochondrial mass and mitochondrial membrane potential in mutant fibroblasts (subject 5), as indicated by reductions in MitoTracker Green (MTG) and TMRE fluorescence, respectively. The bars represent relative fluorescence values, compared to same-day measurements obtained in control fibroblasts. Fibroblasts were loaded with MTG (50 nM) or TMRE (20 nM) for 30 min at 37°C and fluorescence values determined by FACS analysis (Accuri C6). An asterisk () indicates statistically significant reductions in TMRE fluorescence values (p = 0.0009, one-way ANOVA, n = 10). A cross (†) indicates a trend toward a significant reduction in MTG fluoresecence (p = 0.053, one-way ANOVA; n = 8). Data are represented as mean ± SD. (D) Oxygen consumption rate (OCR) of nontransduced and transduced fibroblast cell lines. Fibroblasts from subject 7 (S7) and controls (NDHFneo, LONZA) were transduced with FBXL4wt- and FBXL4mut-expressing construct. OCR was determined as rotenone-sensitive respiration rate of uncoupled mitochondria (n > 7 each) and increased significantly (p < 0.001, t test) after expression of FBXL4wt only. Data are represented as mean ± SD.
Figure 4
Figure 4
Subcellular Localization of FBXL4 (A) Recombinant protein was labeled with α-HA antibody (green), nuclei were stained blue with DAPI, and mitochondria were stained red with MitoTracker. A noninduced HEK293T cell is shown to highlight the specificity of the α-HA antibody. (B) Total cell lysate (CL), cytosol (C), nuclei (N), and mitochondrial (M) fractions were isolated from FBXL4HA-C stably transfected HEK293T cells followed by immunoblot analysis with α-FBXL4 (Abcam) and α-HA (Roche) antibodies. In vitro synthesized human FBXL4 HA-C full-length protein (ivT) was included as control. Mitochondrial subcellular localization was confirmed by immunoblotting based on signal from HSP60 and TOM20 (mitochondrial), SF2 (nuclear), GAPDH (cytosolic). A previously suggested partner of FBXL4, cullin 1 (CUL1), is here shown to be cytosolic. (C) Subcellular fractionations obtained from mouse liver. Mitochondrial subcellular localization was confirmed by immunoblotting based on signal from ETHE1 (mitochondrial matrix), SDHB (mitochondrial membranes), AIFM1 (mitochondrial intermembrane space), and tubulin (cytosolic). (D) Intact mitochondria isolated from FBXL4HA-C stably transfected HEK293T cells after 0 (noninduced) or 5 ng/ml doxycycline induction for 24 hr (induced) were left untreated or incubated with trypsin or digitonin followed by trypsin digestion. Submitochondrial localization was established by comparison of FBXL4 and HA signal from immunoblots to TOM20 (outer membrane), cytochrome c, CYC (intermembrane space), and electron transfer B, ETFB (matrix).
Figure 5
Figure 5
Structural Features of FBXL4 (A) A comparative structure of the F-box and leucine-rich repeat (dark gray) domains of FBXL4, modeled on the X-ray structures of FBXL3 and SKP2. A surface representation of the CRY2 binding partner (light gray) of FBXL3 modeled in the equivalent position with FBXL4 suggests a protein-protein interaction surface is formed by the concave β-sheet of the leucine-rich repeats. Mutations of FBXL4 are shown as colored sticks: p.Gly356Alafs15 (red), p.Ser410Phe (orange), p.Leu433Arg (yellow), p.Arg482Trp (green), p.Ile551Asn (cyan), p.Asp565Gly (blue), p.Gly568Ala (indigo), and p.Gln597Pro (violet). (B) Blue Native Gel Electrophoresis (BNGE) from FBXL4HA-C stably transfected HEK293T cells and induced with 2 ng/ml doxycycline for 48 hr. Samples were separated in 5%–13% gradient nondenaturating gels and immunoblotted for FBXL4 and HA in order to reveal the presence of high-molecular-weight complexes. SDS-boiled sample, NDUFB8 from complex I, and SDHB from complex II were analyzed as controls.

References

    1. McCormick E., Place E., Falk M.J. Molecular genetic testing for mitochondrial disease: from one generation to the next. Neurotherapeutics. 2013;10:251–261. - PMC - PubMed
    1. Zhang W., Cui H., Wong L.J. Application of next generation sequencing to molecular diagnosis of inherited diseases. Top. Curr. Chem. 2012 Published online May 11, 2012. - PubMed
    1. Pagliarini D.J., Calvo S.E., Chang B., Sheth S.A., Vafai S.B., Ong S.E., Walford G.A., Sugiana C., Boneh A., Chen W.K. A mitochondrial protein compendium elucidates complex I disease biology. Cell. 2008;134:112–123. - PMC - PubMed
    1. Elstner M., Andreoli C., Klopstock T., Meitinger T., Prokisch H. The mitochondrial proteome database: MitoP2. Methods Enzymol. 2009;457:3–20. - PubMed
    1. Calvo S.E., Compton A.G., Hershman S.G., Lim S.C., Lieber D.S., Tucker E.J., Laskowski A., Garone C., Liu S., Jaffe D.B. Molecular diagnosis of infantile mitochondrial disease with targeted next-generation sequencing. Sci. Transl. Med. 2012;4:118ra110. - PMC - PubMed

Publication types

MeSH terms